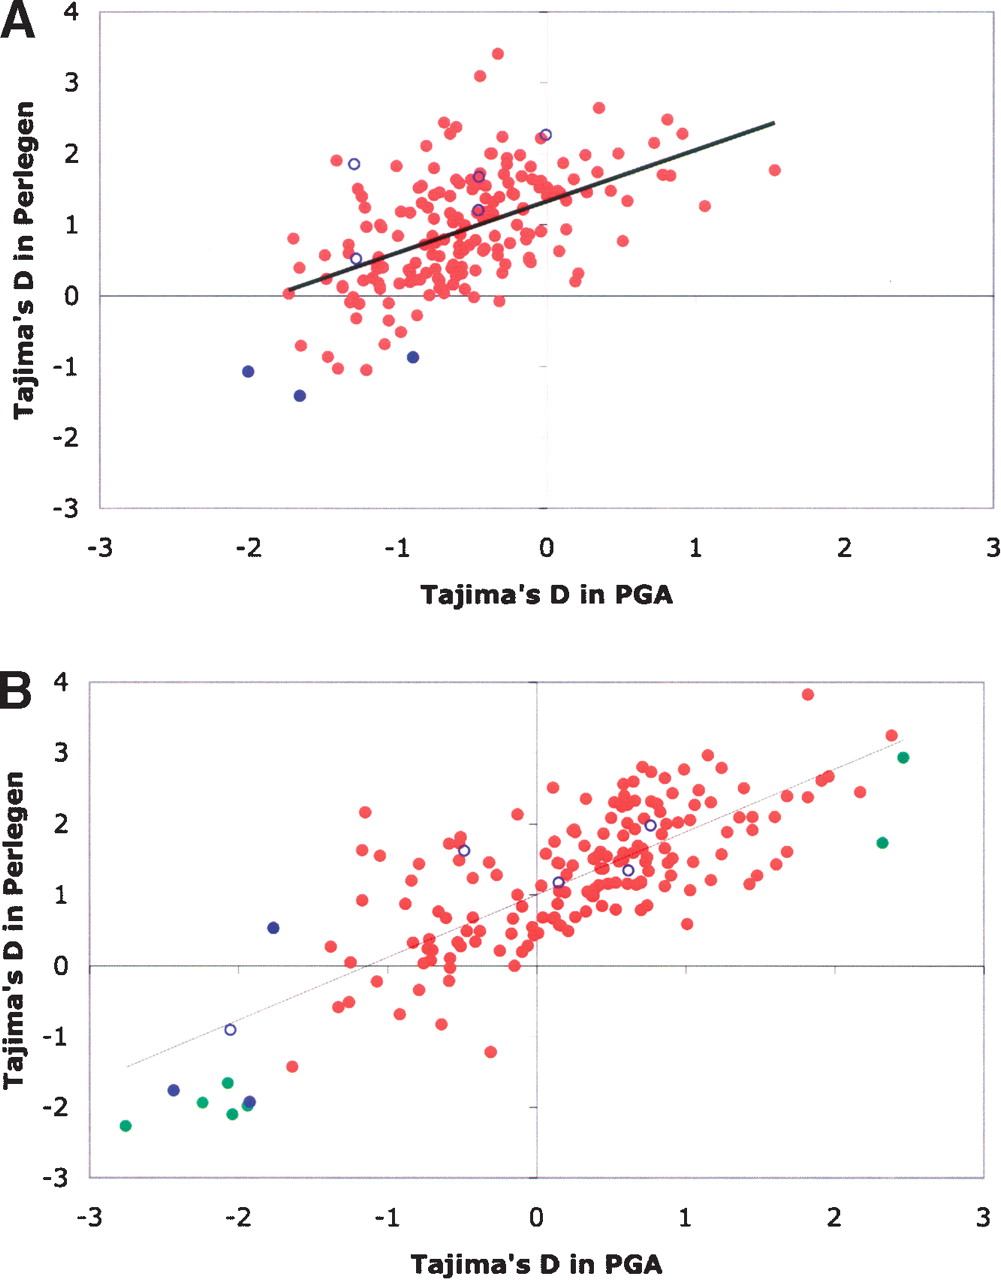
Comparison of Tajima's D between Perlegen and SeattleSNPs data sets. For each gene, Tajima's D was calculated from complete resequencing data in the SeattleSNPs data set, or from the region spanning 10 kb upstream of the transcript, the full transcript, and 10 kb downstream of the transcript in the Perlegen data. (A) Tajima's D from Perlegen vs. Tajima's D from SeattleSNPs for AD population. (B) Tajima's D from Perlegen vs. Tajima's D from SeattleSNPs for ED population. Genes previously resequenced by SeattleSNPs are shown in red, with a trend line representing a linear regression on the data. Genes resequenced as part of the present study are shown as purple dots, with filled circles indicating that the gene lay within a CRTR in the population being plotted. The seven SeattleSNPs genes with robust signatures of selection in SeattleSNPs data are shown in green (Akey et al. 2004).