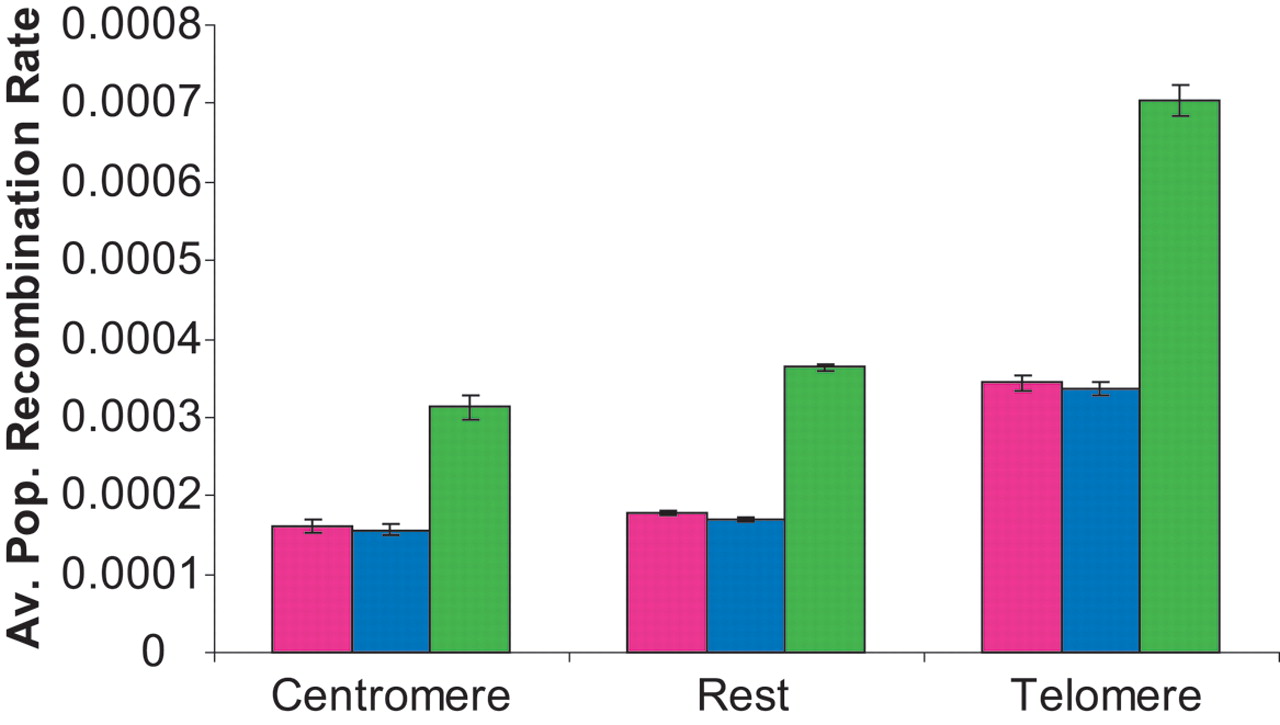
Figure 1.
Average value of [TeX:] \batchmode \documentclass[fleqn,10pt,legalpaper]{article} \usepackage{amssymb} \usepackage{amsfonts} \usepackage{amsmath} \pagestyle{empty} \begin{document} \({\hat{{\rho}}}\) \end{document} in each population for, respectively, telomeric regions, centromeric regions, and the rest of the genome. The mean values of the European-American population are in blue, of the Han Chinese in pink, and of the African-Americans in green. The bars represent two standard errors from the mean.