Skip to main content
Figure 1.
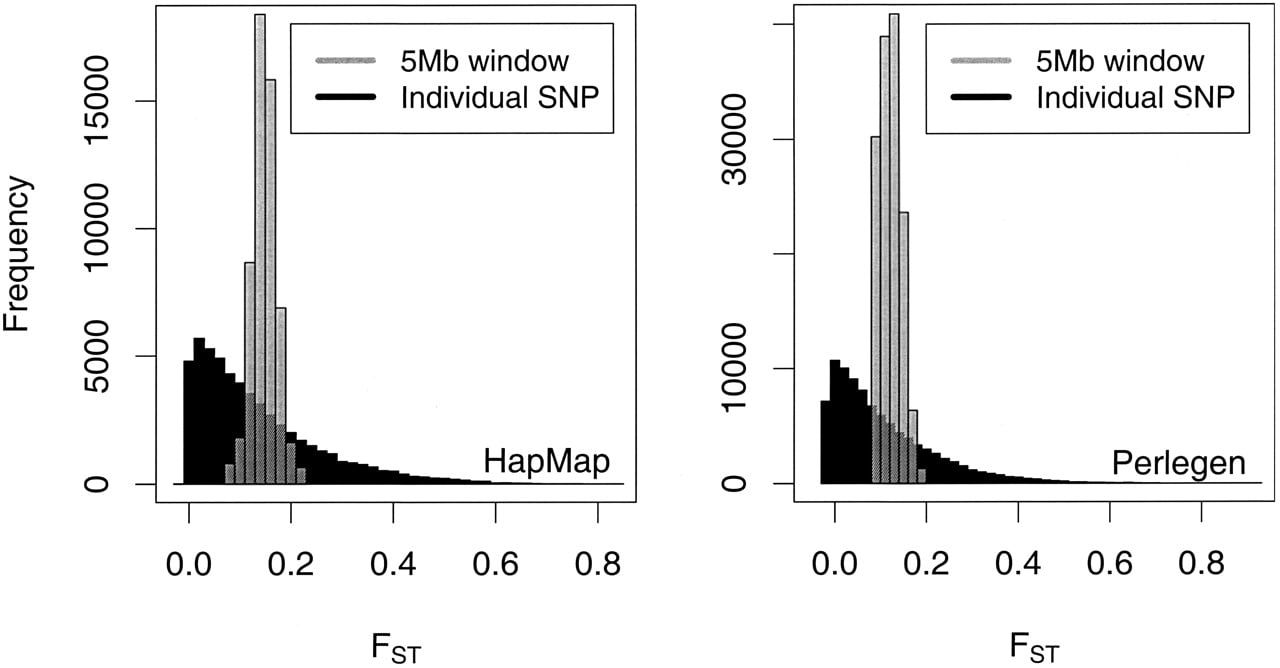
Histograms of single-locus and 5-Mb window values of
F
ST
over the human genome.