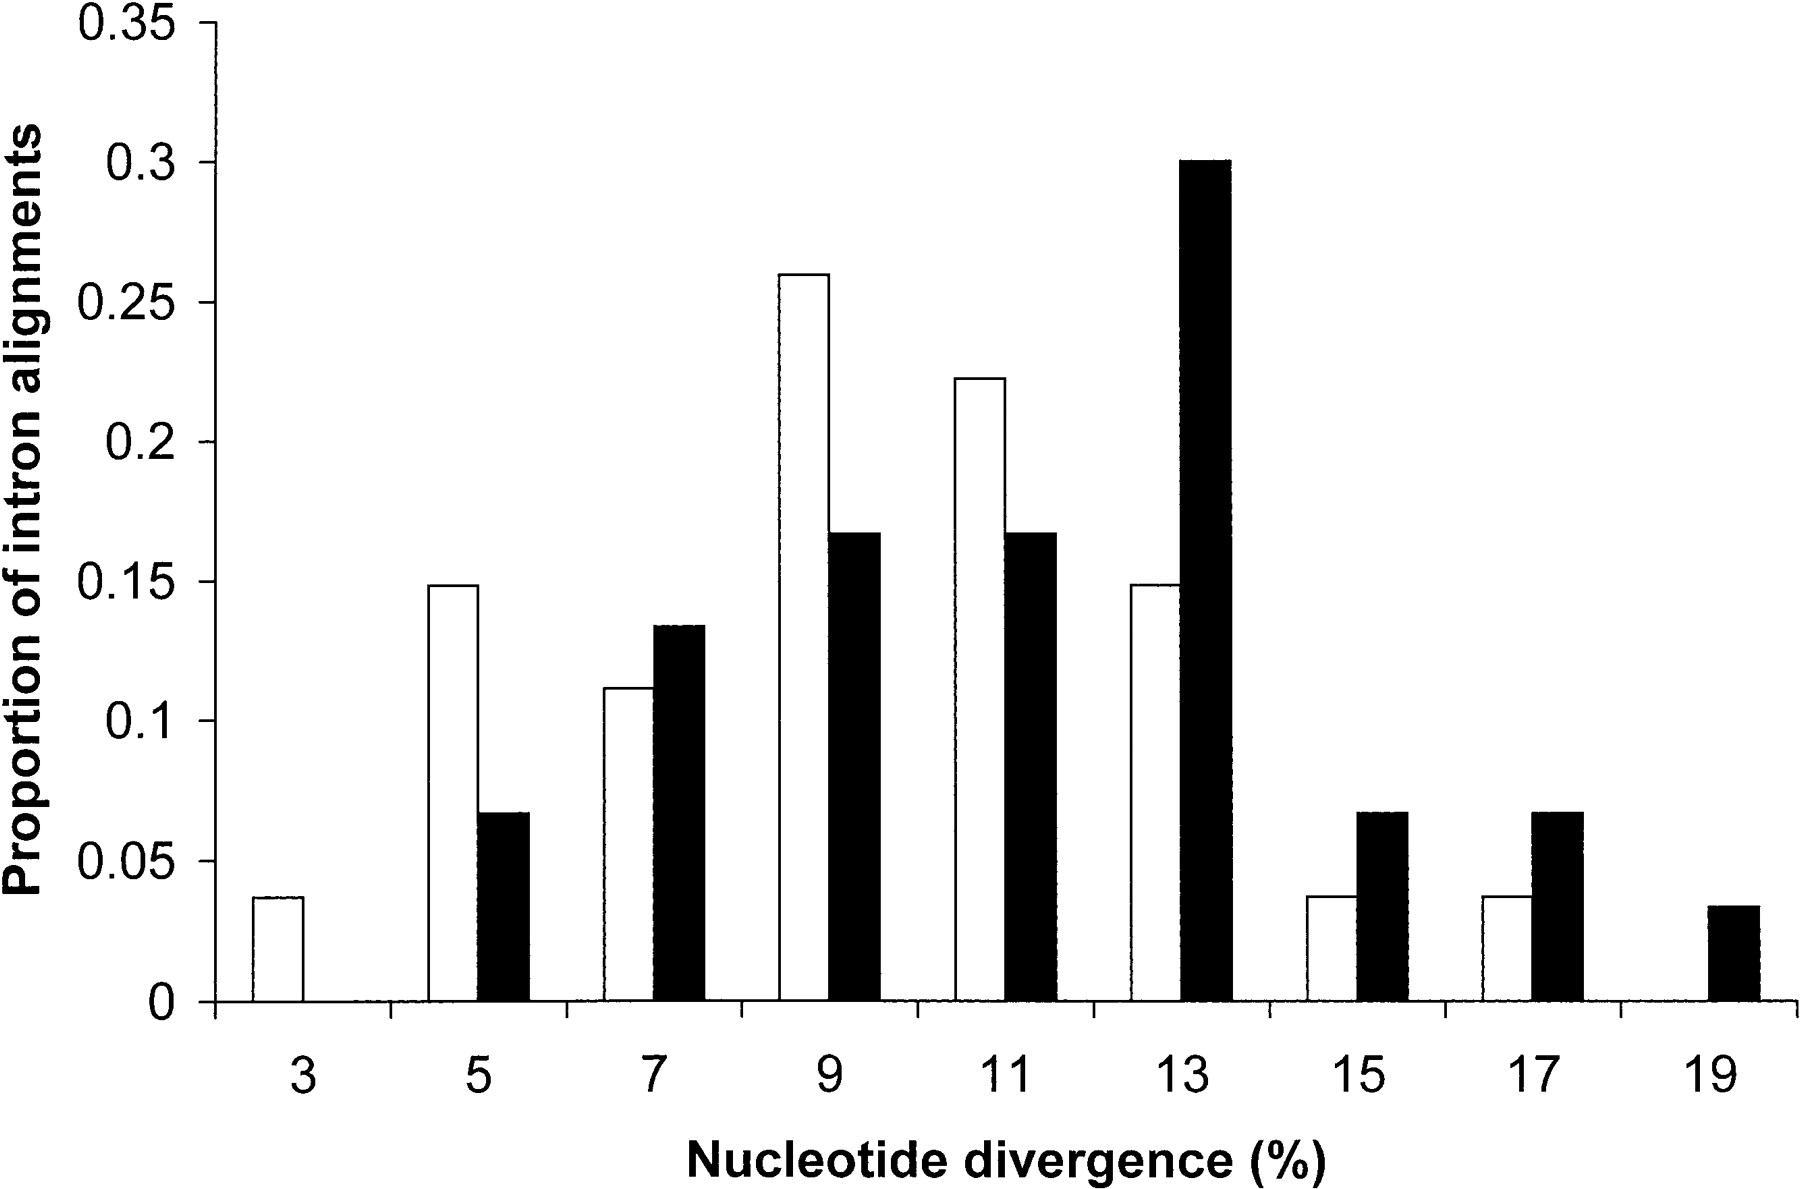
Figure 1.
Histogram showing levels of chicken-turkey divergence in 27 macrochromosomal (white bars; chromosomes 1-5) compared with 30 microchromosomal introns (black bars; chromosomes 11-38). The X-axis shows the midpoint of each category, and the height of bars represents the relative proportion in each category.