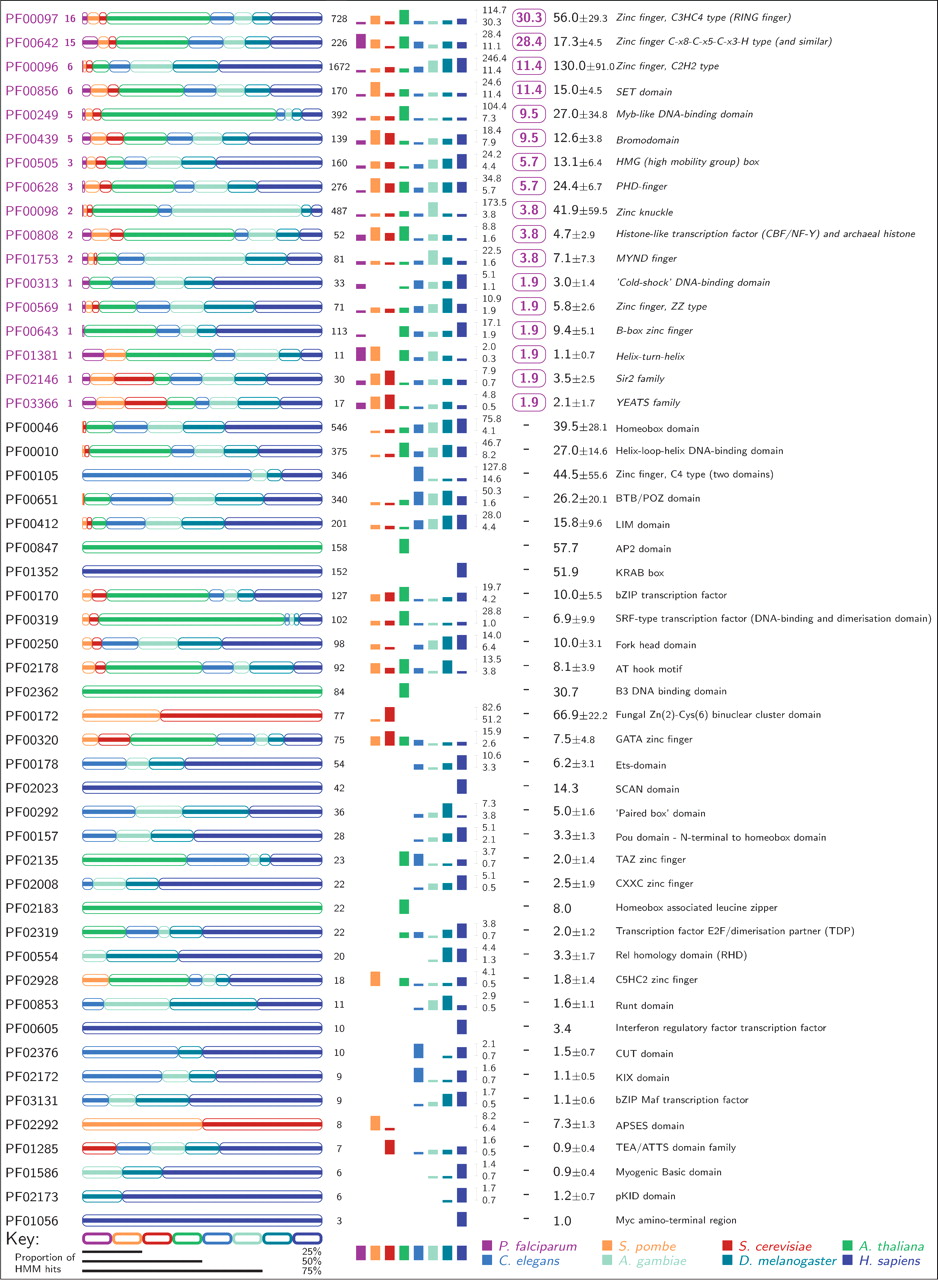
Phylogenetic distribution of genes matching TRANSFAC-linked HMMs. The first column shows the Pfam accession numbers of the HMMs used in the genome searches (Table 1). If the HMM matches any malaria sequences, it is shown in purple, along with the number of P. falciparum sequences matching it (also in purple). The length of the strips in the next column (color-coded by species, see the key), indicates the proportion of sequences in a particular species, of the eight genomes that are matched by the HMM. The total number of sequences matching the HMM is indicated on the right of these strips. The bar graphs show the number of sequences that match the HMM, normalized by genome size and expressed as number of sequences per 10,000 genes. The two numbers above each other, and immediately to the right of the bar graphs, show the maximum and minimum normalized number of matches observed when the genomes were searched with the particular HMM. In the following column, if an HMM matches P. falciparum sequences, the normalized number of matching malaria sequences is displayed in the purple rounded box. HMMs matching only crown eukaryote group sequences are indicated by dashes. The penultimate column shows the average, normalized number of matches to the HMM in the seven crown eukaryote group genomes, along with the standard deviation. The final column shows the Pfam description of the HMM — this is in italics if the HMM matches malarial sequences.