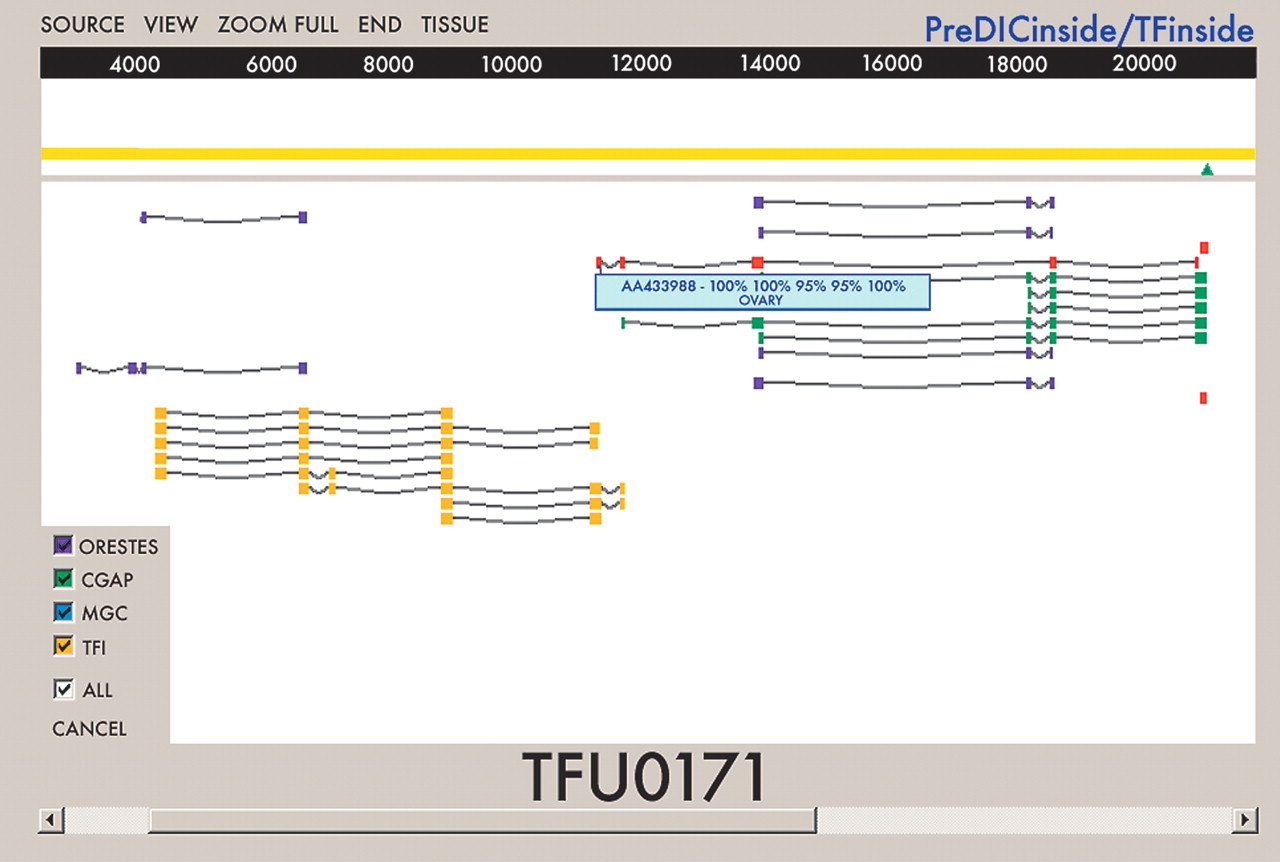
TFI graphical interface. The TFI graphical interface displays a region of the human genome sequence as a yellow line, with a scale in base pairs (bp). Expressed sequence tags (ESTs) that align with the genome sequence are shown in different colors, depending on the project of origin: ORESTES from the FAPESP/LICR Human Cancer Genome Project in purple; CGAP in green, MGC in blue, and TFI in yellow, with splicing structures represented as gray lines. The interface shows an experimentally validated TFU (number 171) joining two EST clusters. The TFI interface also provides information on the tissue of origin of the transcript sequences, the percentage of similarity of each exon with the human genome sequence, and the presence of 3′ tags represented as green triangles.