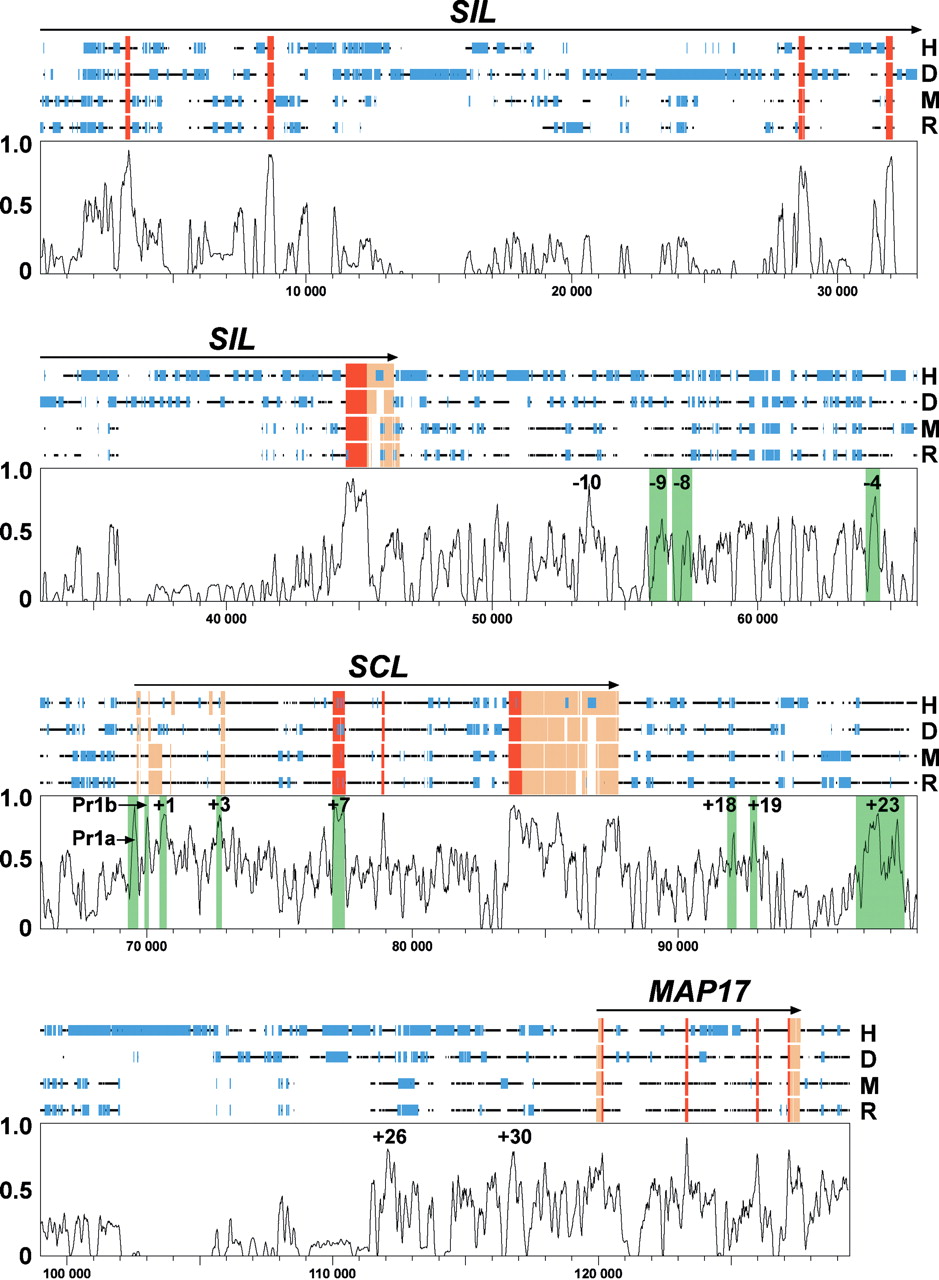
A long-range four-way mammalian alignment is capable of detecting all known SCL regulatory regions. A SynPlot representation of a human/dog/mouse/rat alignment of the SCL locus. Numbers on the horizontal axis do not refer to any one of the sequences in the alignment, but instead represent distance in nucleotides from the beginning of the aligned file (i.e., gaps in the alignment are counted). Numbers on the vertical axis represent an alignment score in a 100-bp window moved by 25-bp increments across the entire alignment. The horizontal black lines above the profile represent the human (H), dog (D), mouse (M), and rat (R) sequences and illustrate the position of gaps introduced to permit optimum alignment. Coding and noncoding exons are demonstrated by red and brown boxes, respectively, and repeats are illustrated by the smaller blue boxes. Regions of open chromatin and the +23 kb enhancer are shaded in green over the plot. Peaks of conserved sequence can be seen within each known regulatory region. Three well conserved peaks in regions of unknown function (-10 kb, +26 kb, and +30 kb) are also indicated. Pr1a, promoter 1a; Pr1b, promoter 1b.