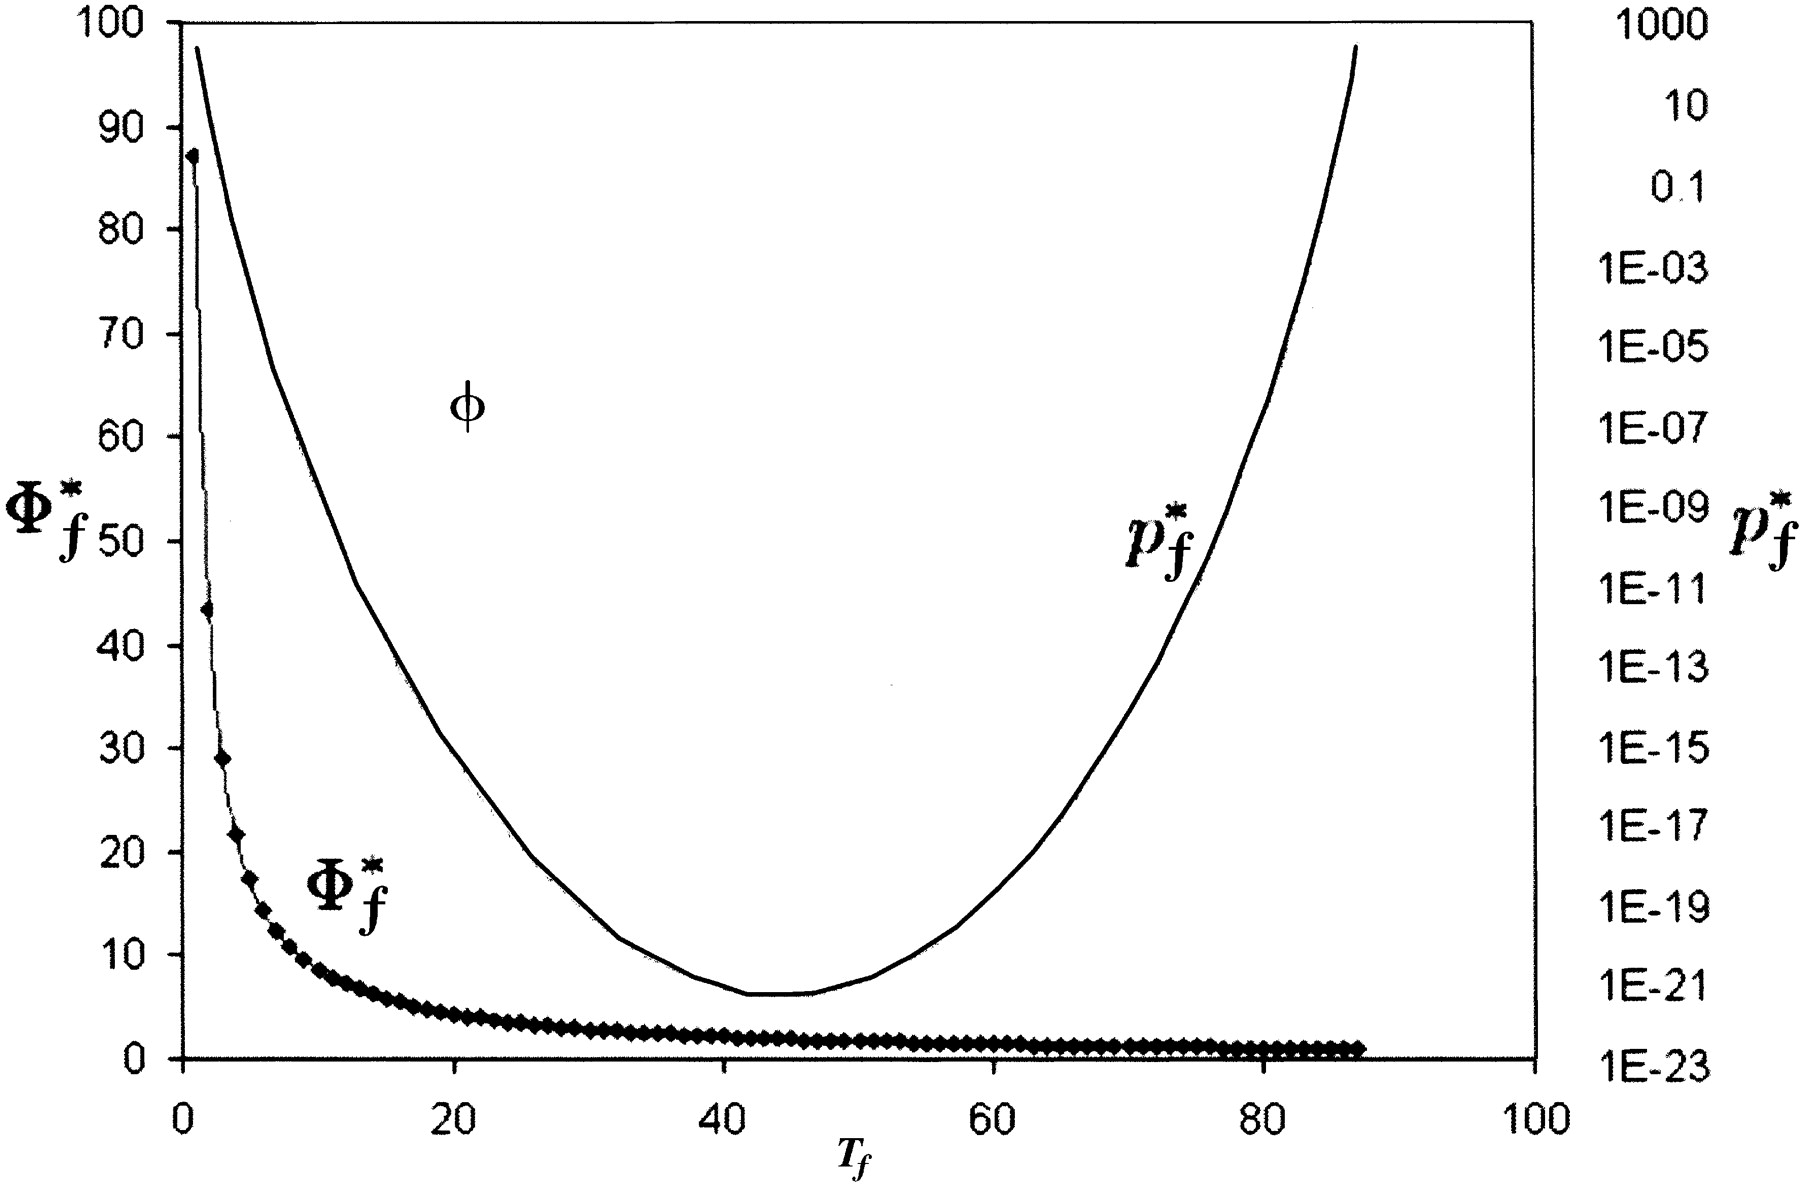
Figure 1
Relationship between maximum propensity Φ and minimum estimated [TeX:] \batchmode \documentclass[fleqn,10pt,legalpaper]{article} \usepackage{amssymb} \usepackage{amsfonts} \usepackage{amsmath} \pagestyle{empty} \begin{document} \(P_{f}^{*}\) \end{document} as a function of the number of organisms exhibiting phenotype f, given that there are N = 86 total genomes and that we are testing X = 4000 genes.