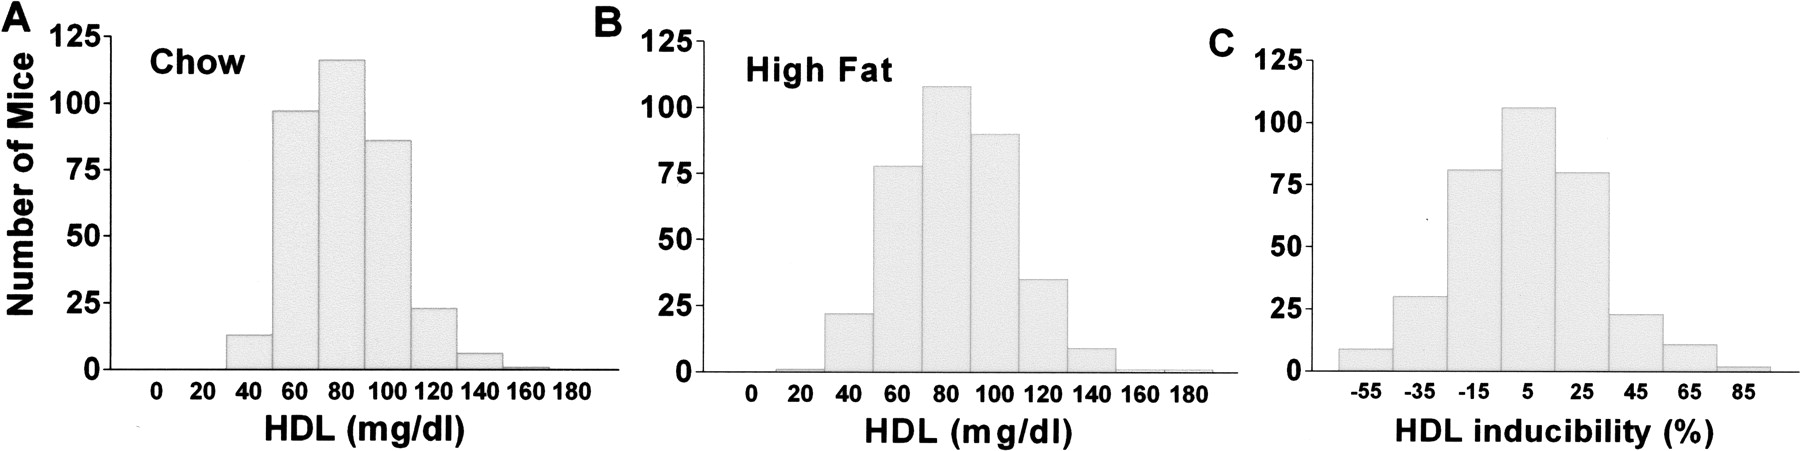
Figure 1
Distribution of HDL concentrations and HDL inducibility in the 345 female (B6 × NZB)F11 AIL progeny. HDL concentrations were determined before (A) and after (B) the mice consumed the high-fat diet for 6 weeks. (C) HDL inducibility was calculated as follows: ([HDL concentrations of mice fed a high-fat diet - HDL concentrations of mice fed chow]/HDL concentrations of mice fed chow) × 100%.