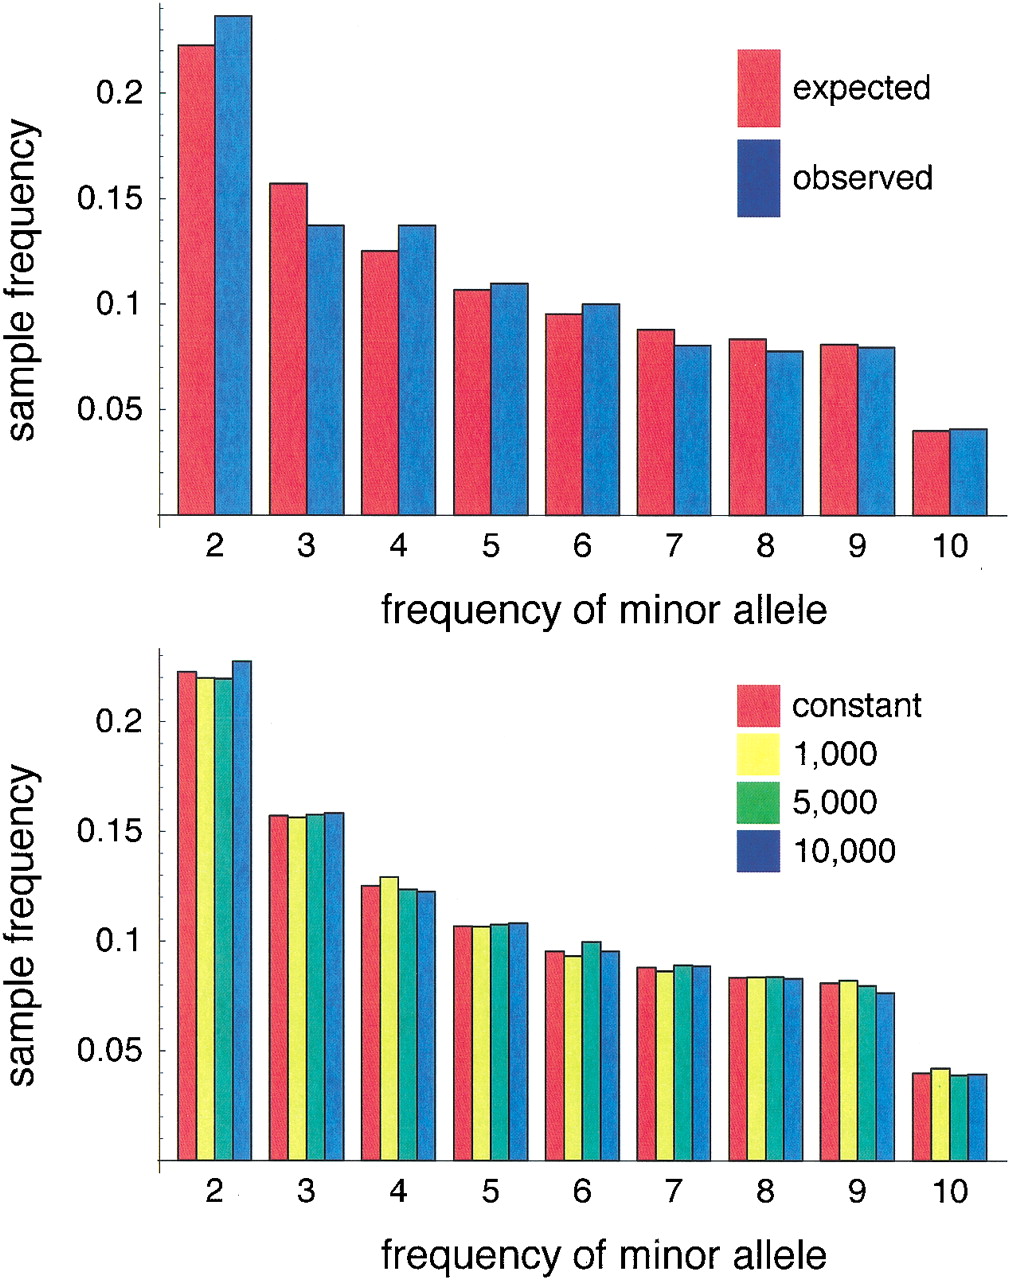
Figure 1
Histogram of allele frequencies. The upper panel shows the observed distribution together with the distribution expected in a standard neutral model with constant population size. The lower panel shows the distribution expected with a constant population size, together with the distributions expected under three scenarios of exponential growth from an ancient constant size of 104 to a modern size of 109.The three scenarios make different assumptions about when growth started: 1000, 5000, or 10,000 generations ago. The histogram is based on the 2148 SNPs for which all 20 chromosomes were genotyped.