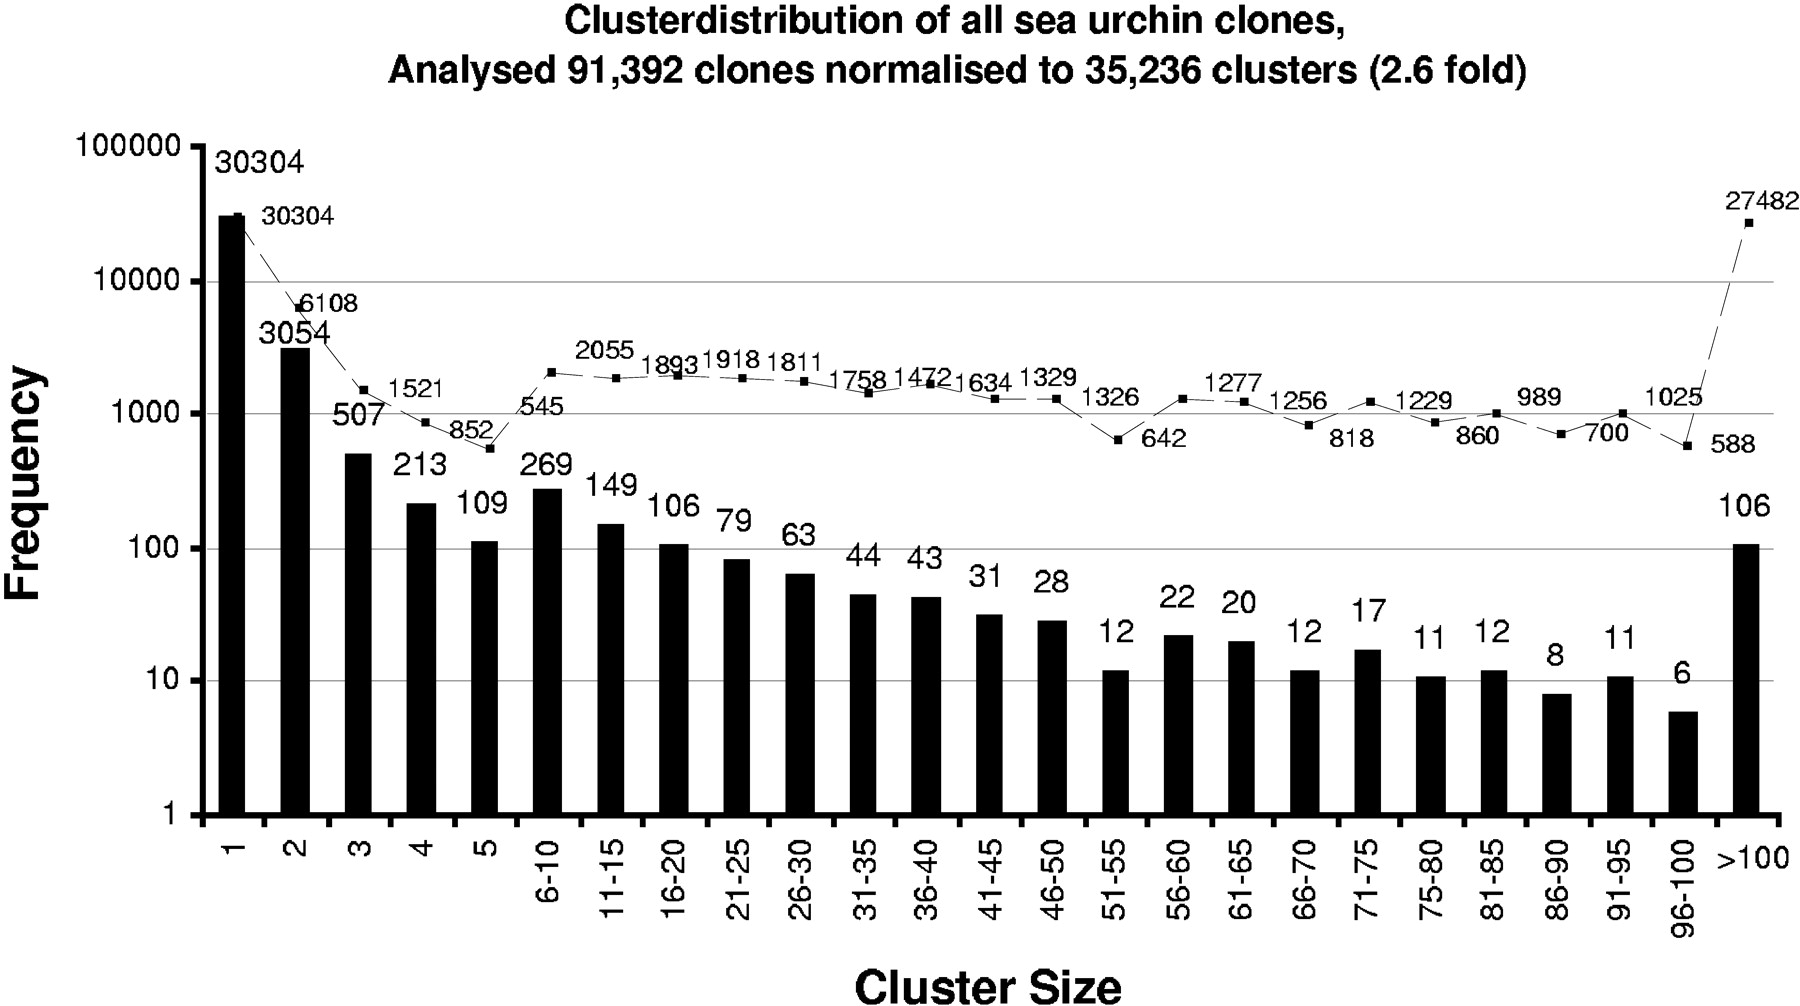
Histogram of the size distribution of the oligonucleotide fingerprinting (ONF) clusters reflecting the abundance distribution of all clones across all libraries, that is, all analyzed developmental stages. The X-axis shows the cluster size (clusters containing more than five clones are grouped). The Y-axis represents the frequency of each cluster size group, which is also given at the top of the bars representing the group, overlaid with the actual number of clones in that category (i.e., 106 clusters of size >100 with 27,482 clones). In total, 91,392 clones were analyzed by ONF clustering (see Methods), and about a third of the clones (27,482) belong to the superprevalent class, summarized in only 106 clusters. A third of the clones (30,304) exist in only one copy in any of the libraries (presumably complex class transcripts). In total, 35,238 different clusters were identified, which indicates that a 2.6-fold normalization was achieved.