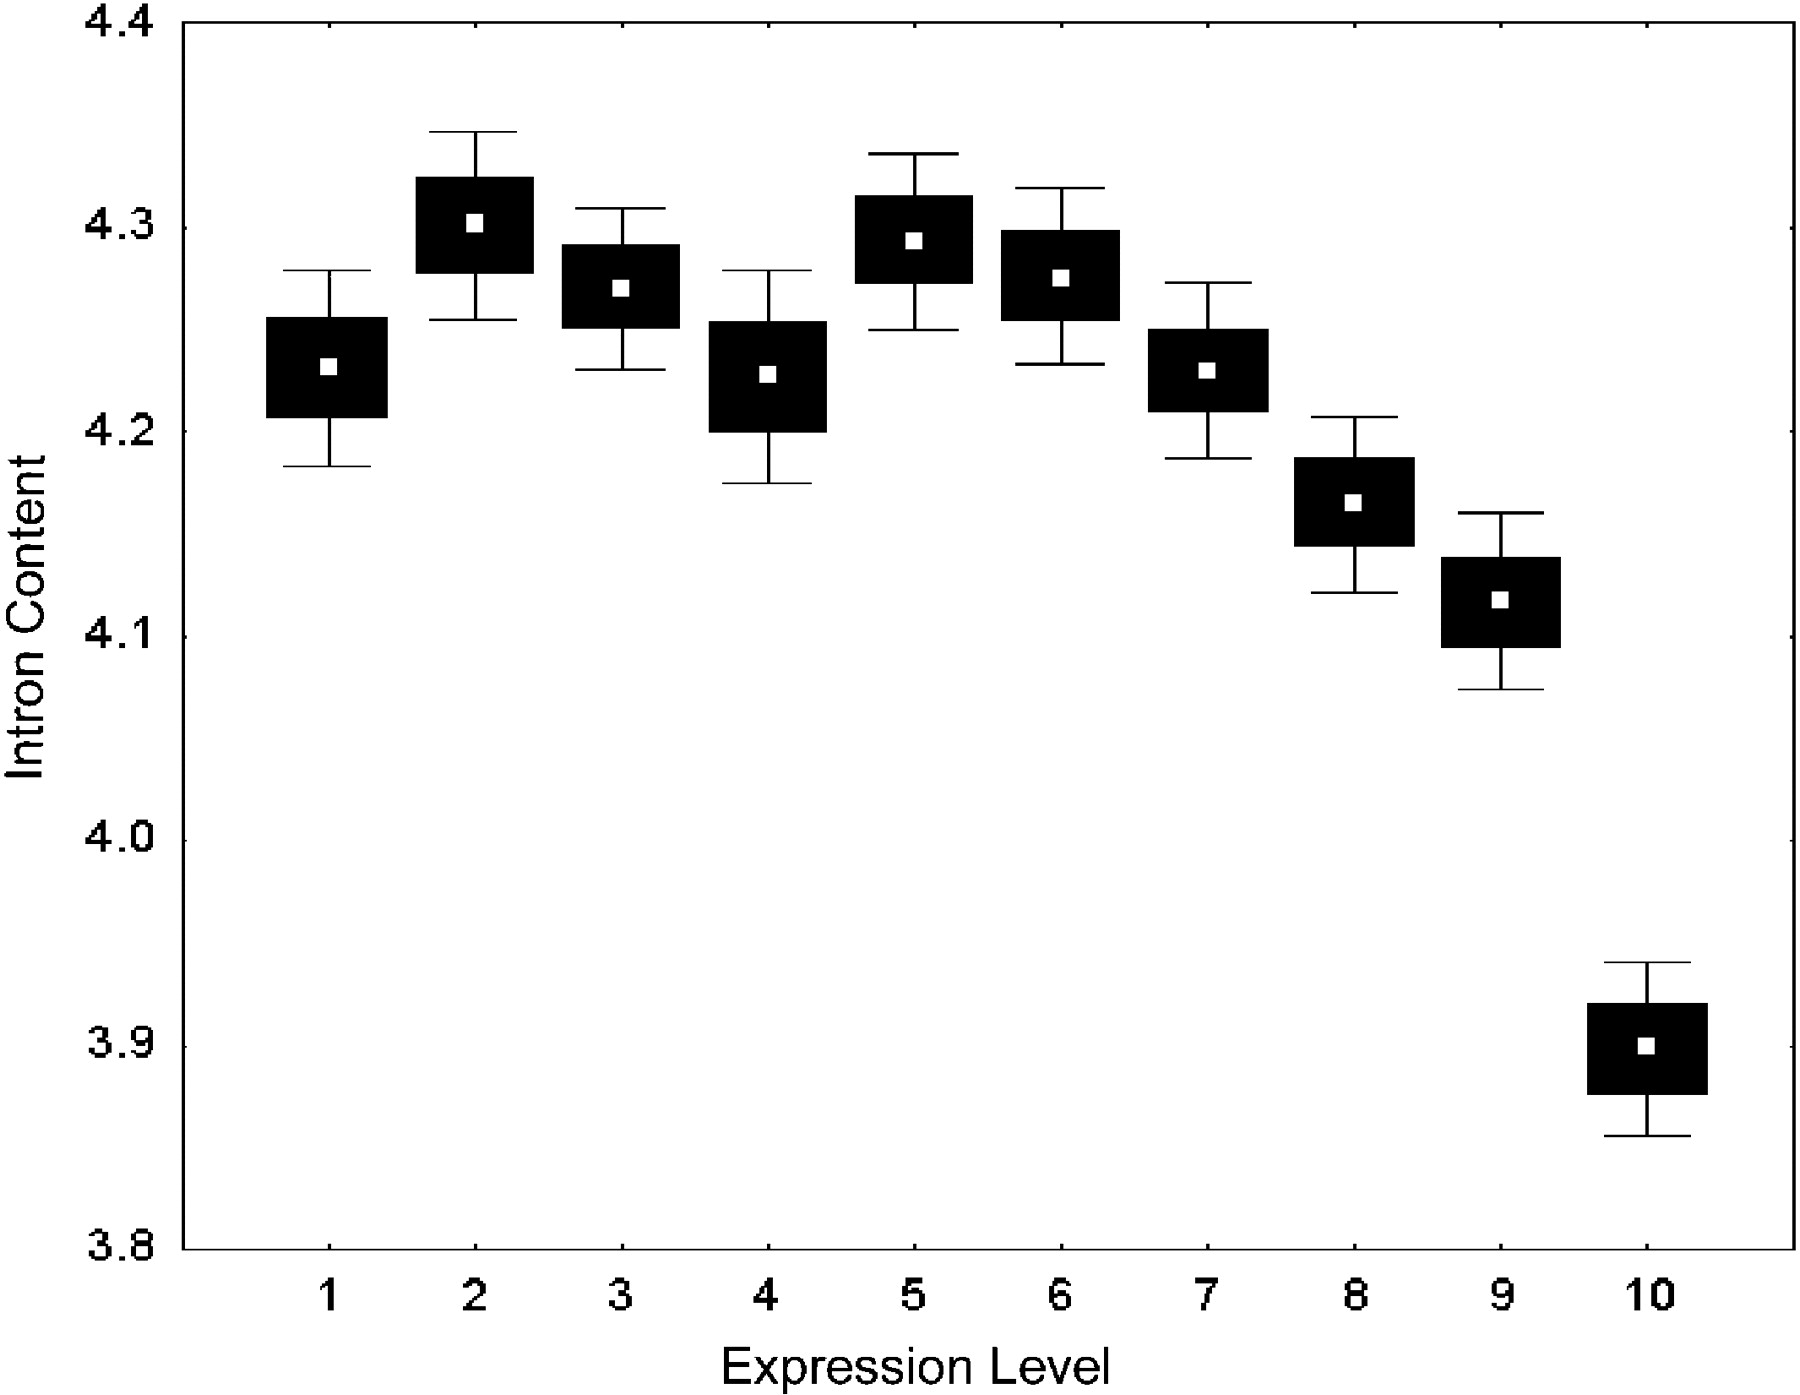
Figure 1
Intron content and expression level in human genes. Genes were split into 10 groups of an equal number of cases according to expression level. White dots represent the mean expression value for each group. Black boxes and error bars show the standard error with 68% and 95% of confidence.