Figure 1
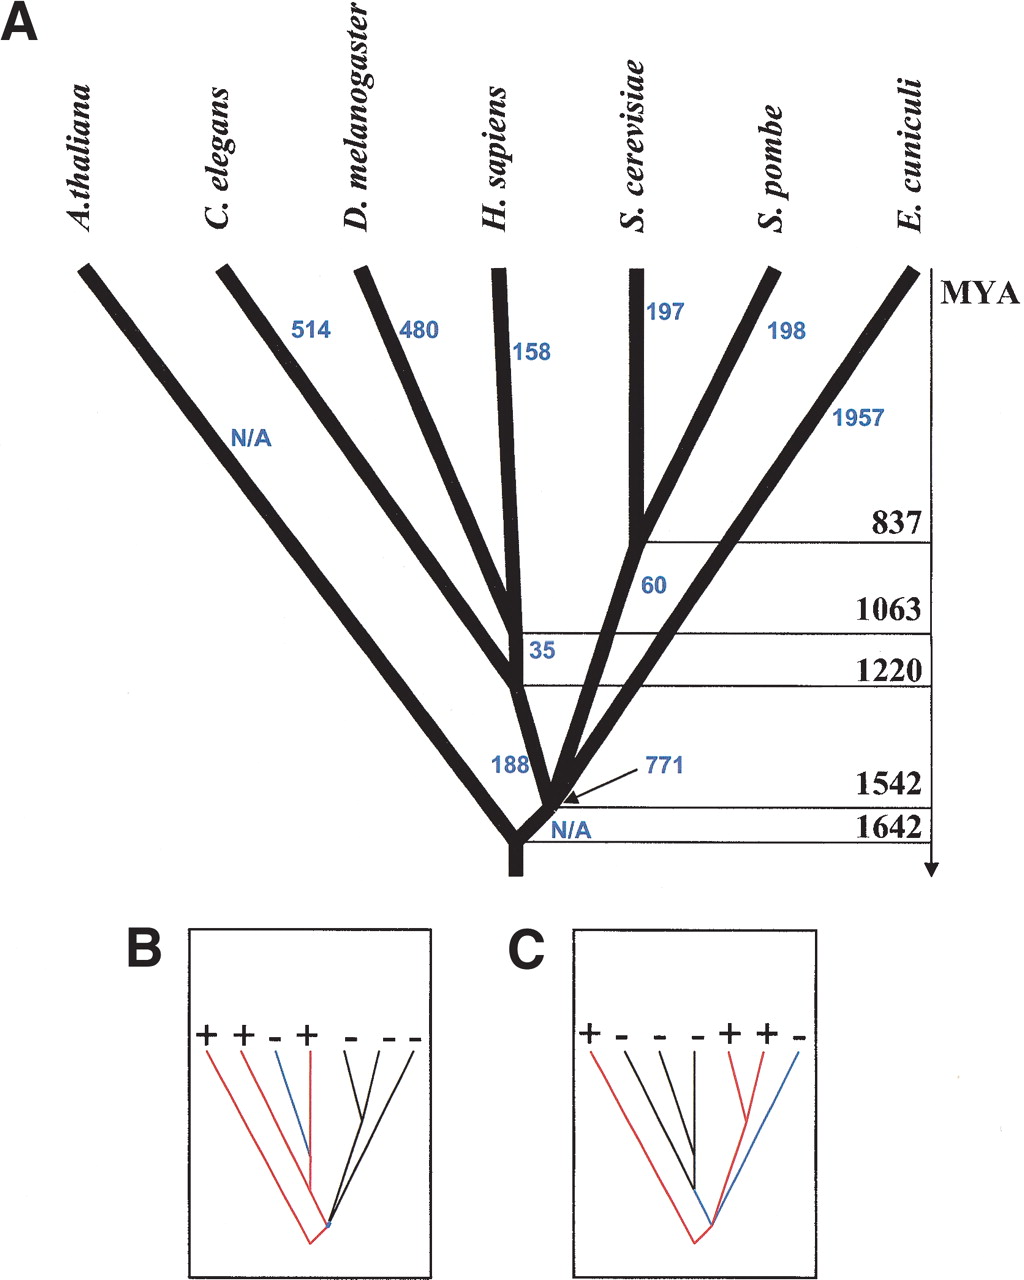
The phylogeny of eukaryotes and PGL calculations. (A) Estimated divergence times in millions of years ago (MYA) are shown for all internal nodes of the tree; the estimates are from Hedges et al. (2001). The number of lost genes according to the reconstructed parsimonious scenario is shown next to each branch. (B, C) Examples of PGL calculation. The presence and absence of a gene in each of the extant species is indicated by “+” and “-”, respectively. Red branches are those that retained the gene; blue branches are those to which a loss was mapped. (B) The loss of gene in the branch leading to the common ancestor of yeasts and microsporidian is shown by a blue dot because this branch formally has zero length.