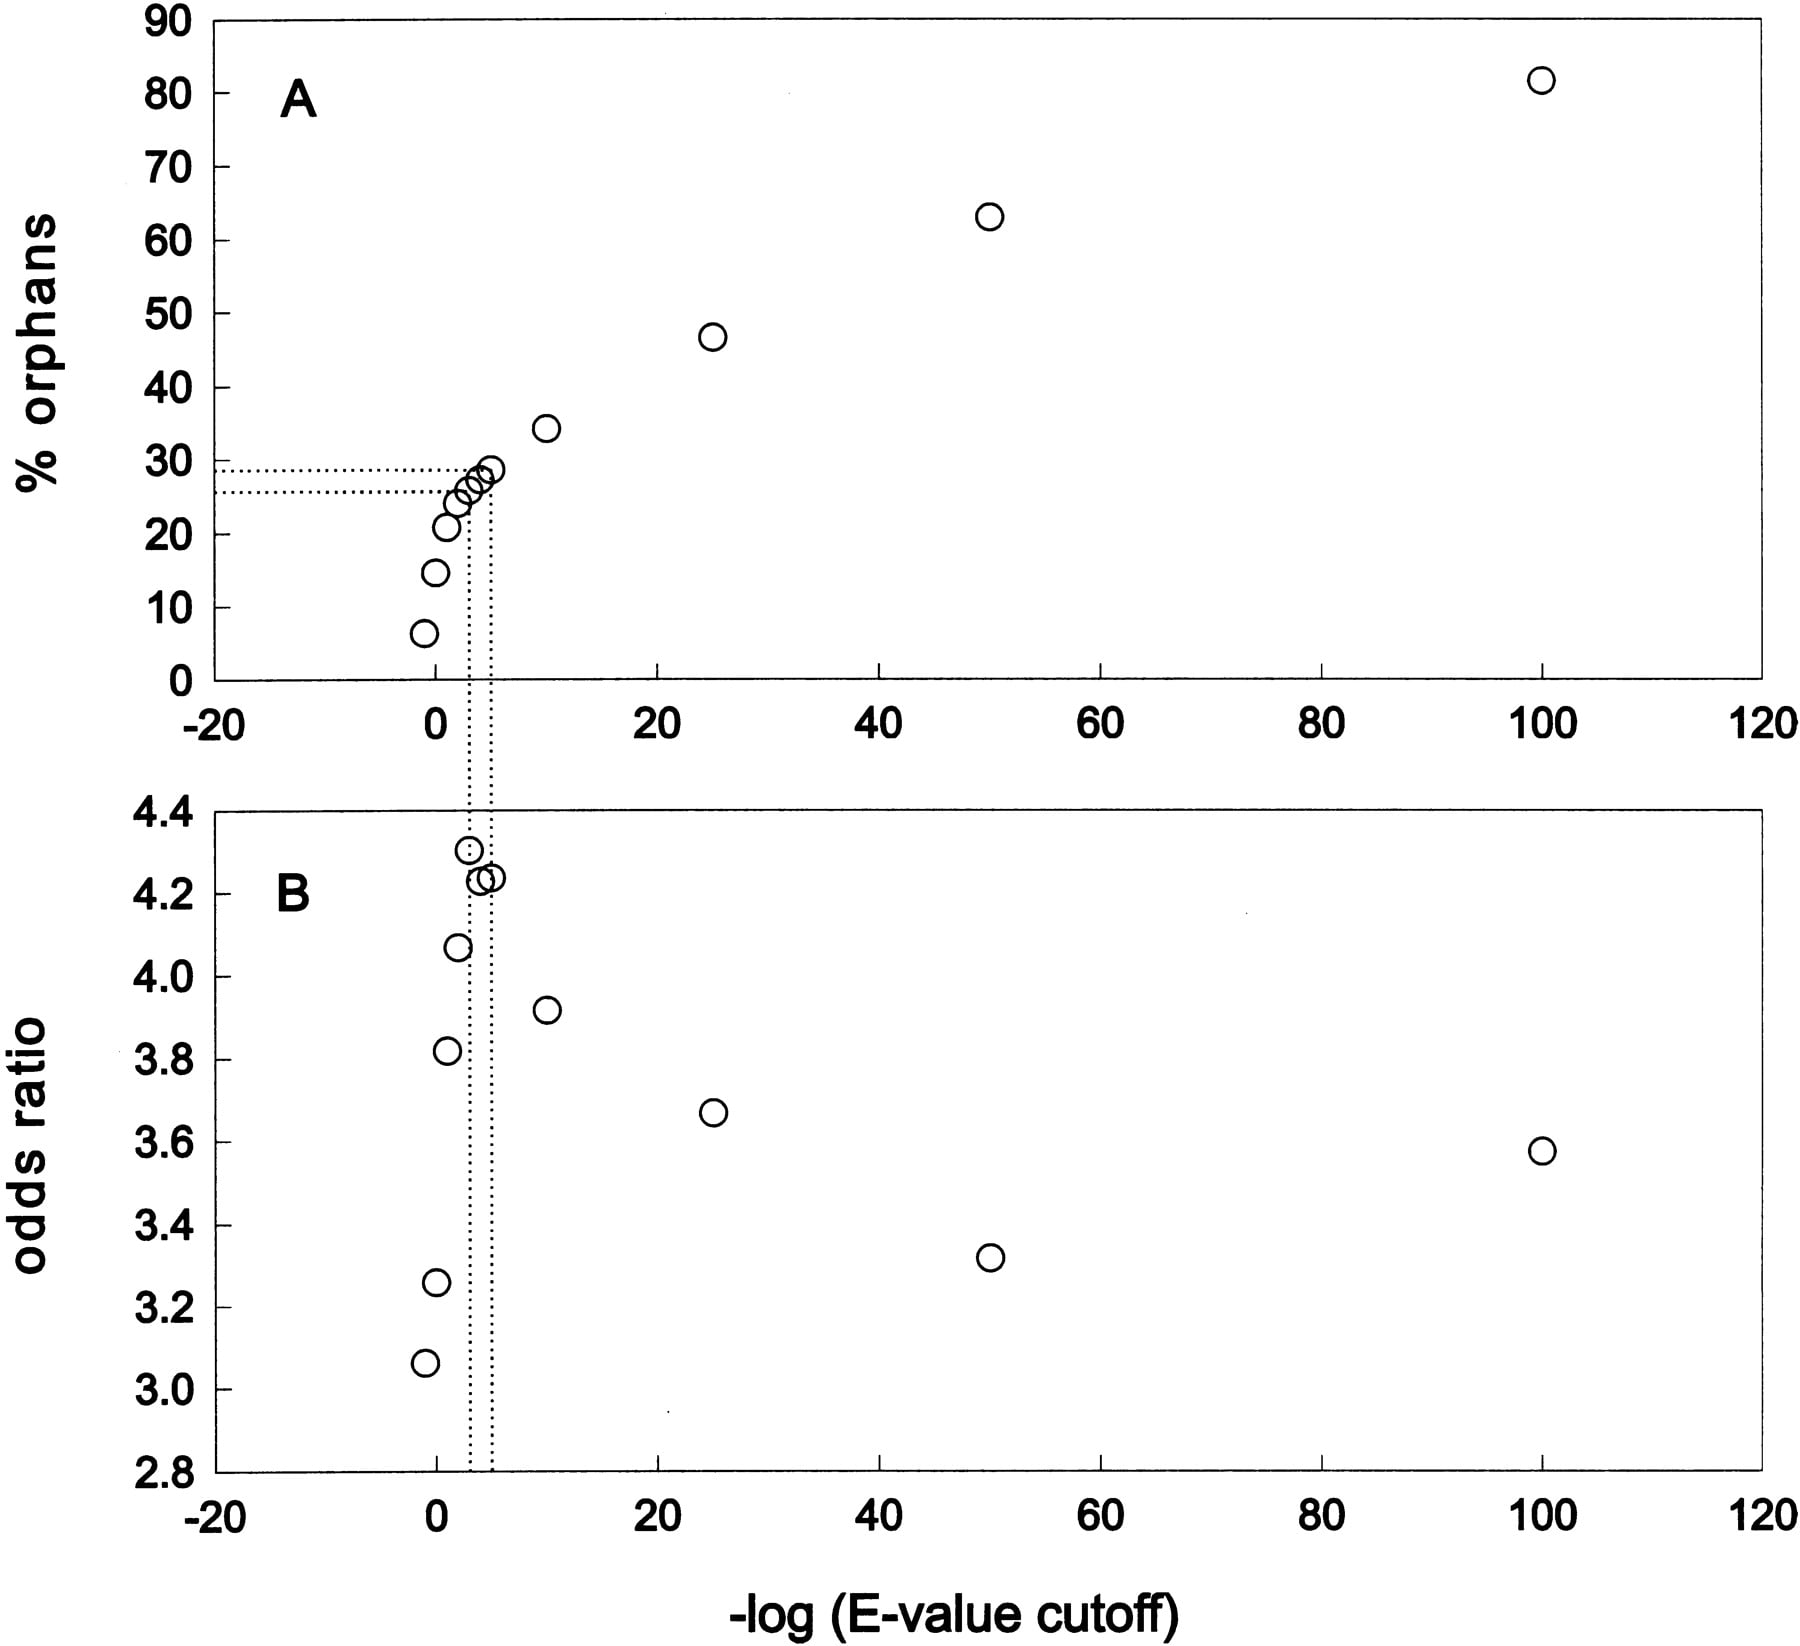
Figure 1
(A) Percentage of orphans found in each cutoff category. The broken lines indicate the BLAST E-value range of 10-3 to 10-5, for which we find 26%-29% orphan genes and the highest odds ratio (see below). (B) Odds ratios for genetically studied genes in the different cutoff classes. The values indicate how much more likely one finds a genetically studied gene in the nonorphan class for a given cutoff. All values are highly significant (P « 0.001 Fischer's exact test).