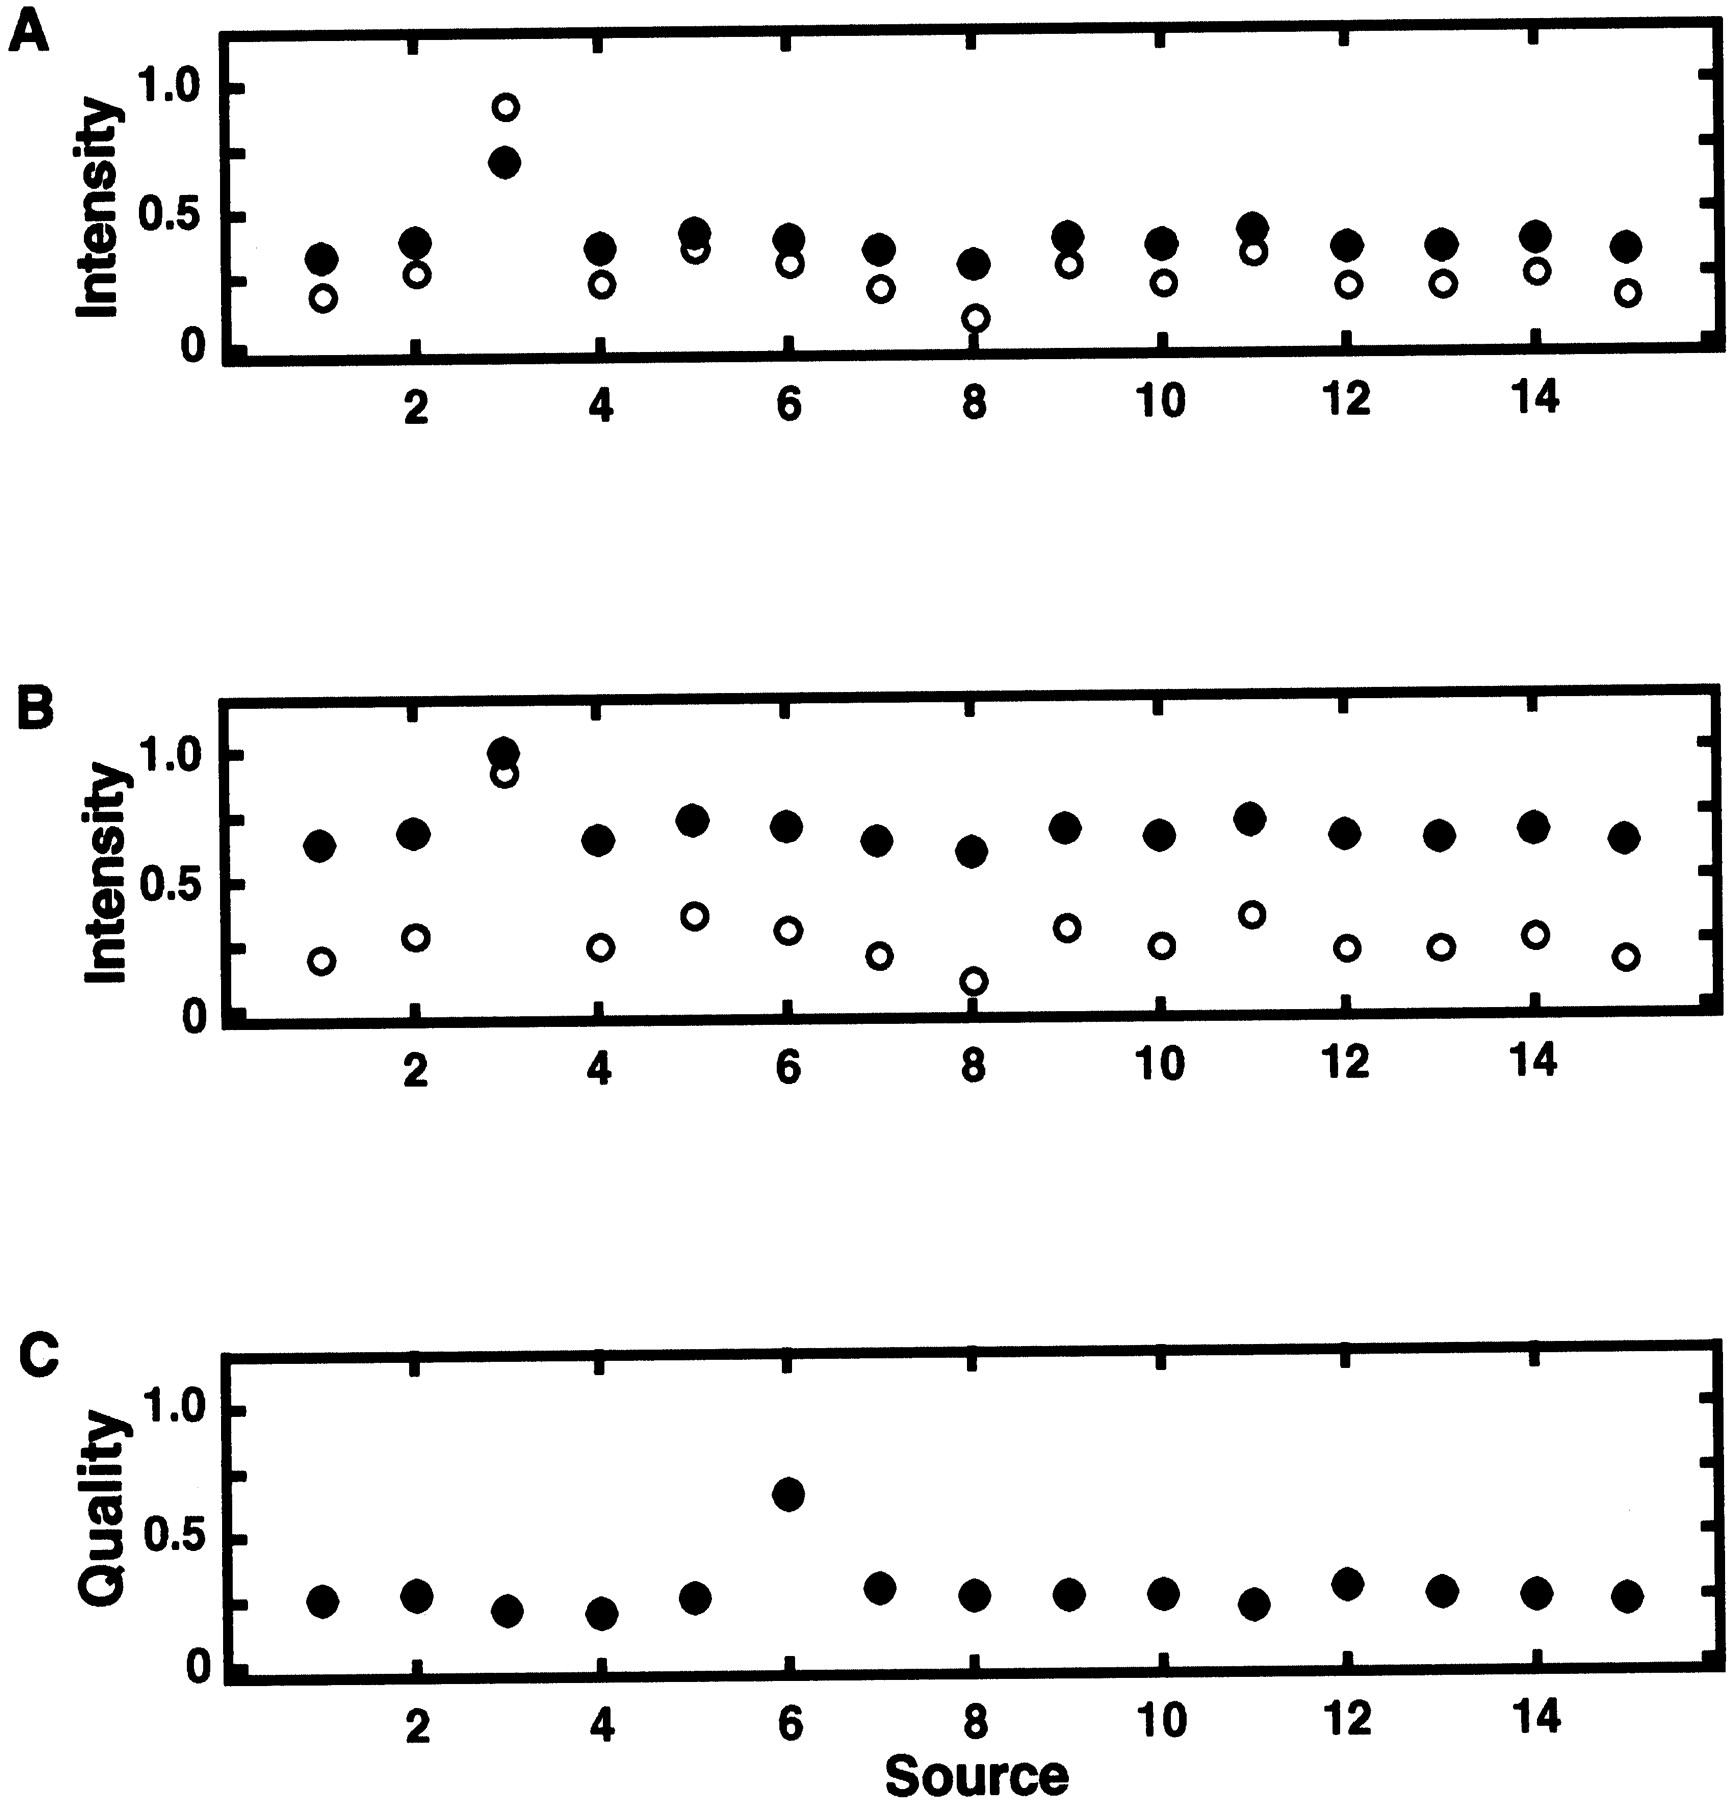
Figure 9.
Examples of synthetic, yet realistic, intensity (abundances) vs. source (library) data for genes. (A) Example 2 (●) and example 1 (○) are compared; (B) example 3 (●) vs. example 1 (○); (C) source qualities corresponding to the intensities. In A and B, the putative selective expression occurs in the third source. The numerical values of the data along with the computed baseline estimatex̂ baseline and separation ratios τ are presented in Table 3. The accompanying selective expression algorithm summarized calculations are in Table 4.