Skip to main content
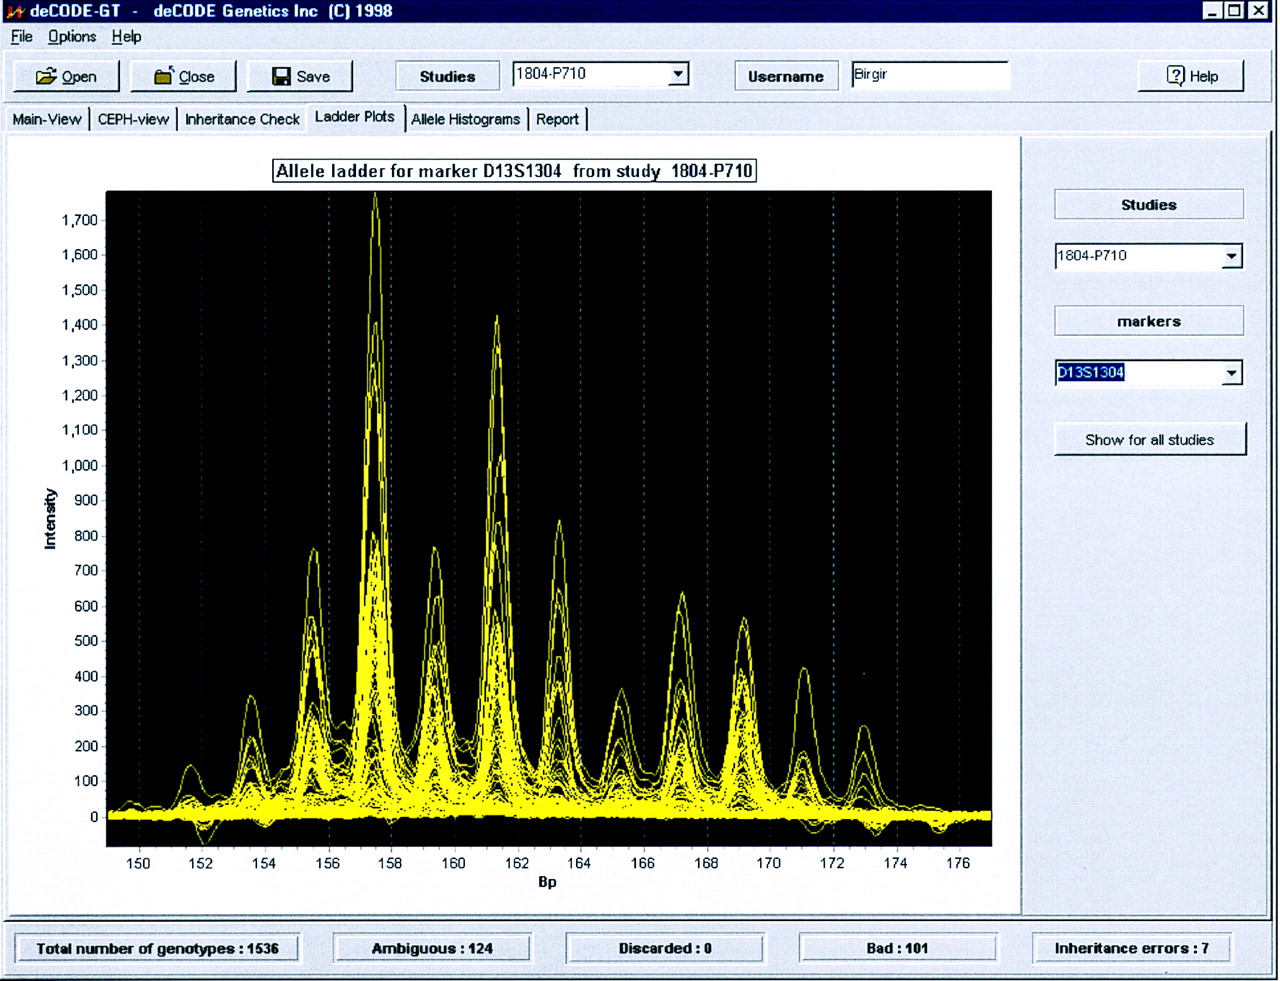
Figure 9.
The allelic ladder view shows all the electropherograms for one marker superimposed in one graph.