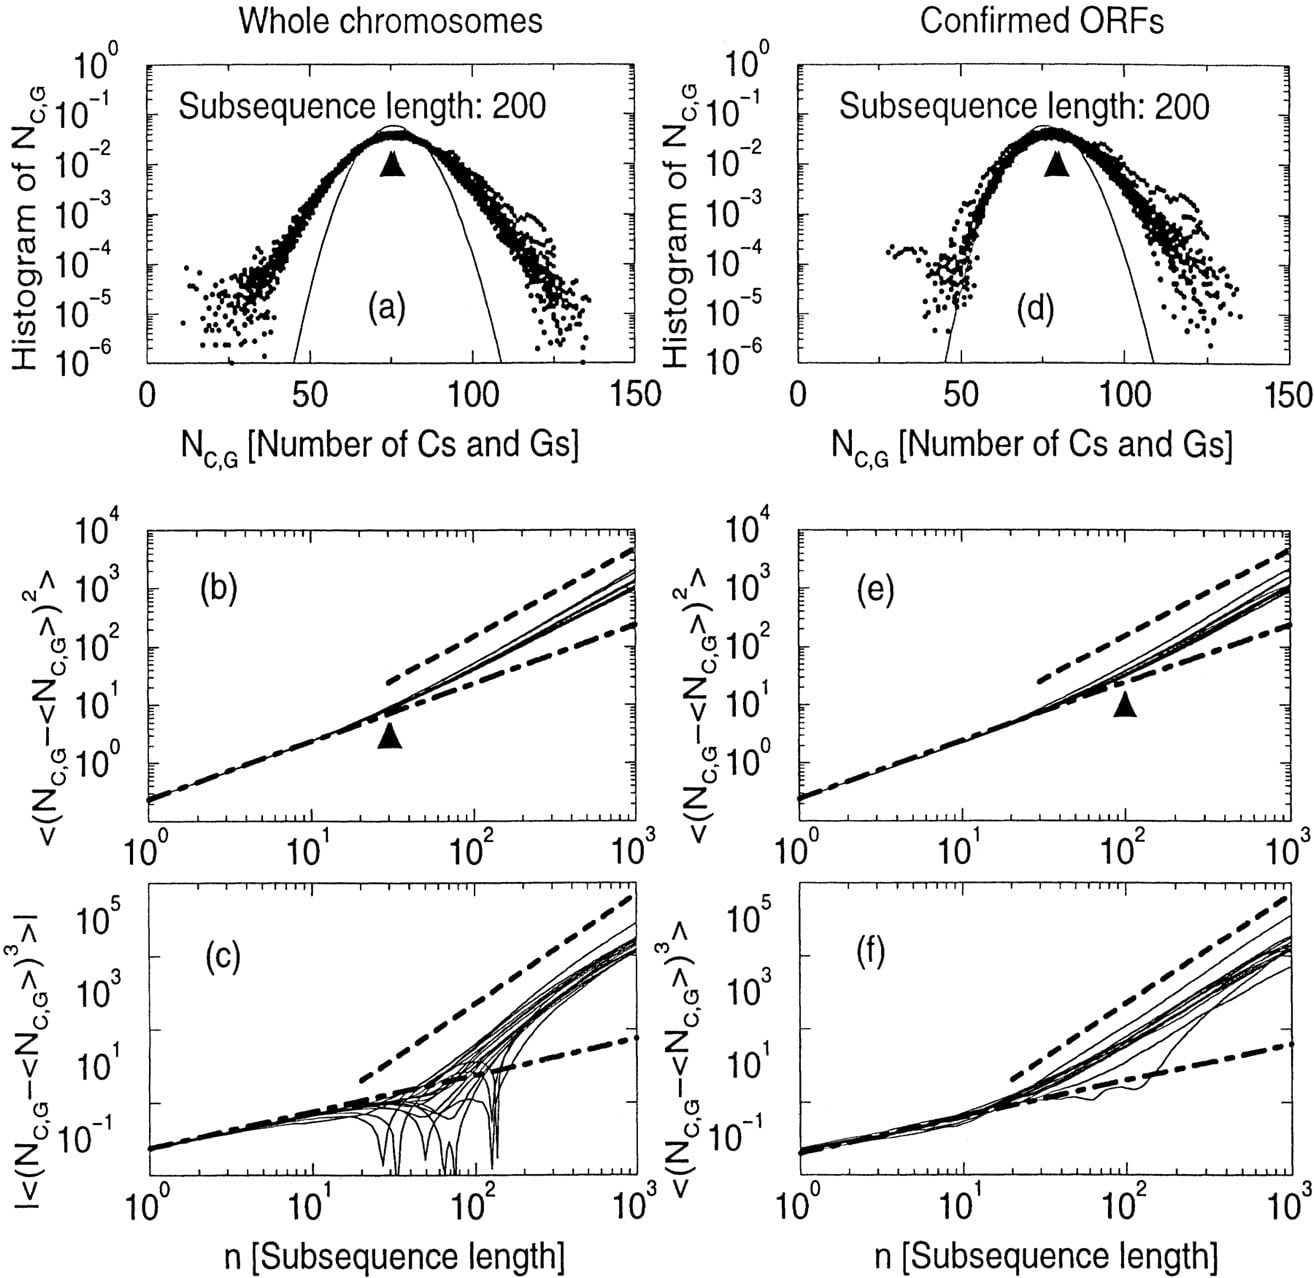
Figure 9.
(a) The histogram of C + G% for length 200 subsequences,P(Ncg,n ), for all 16 yeast chromosome sequences (in linearlog scale). (b) The second-order moment (variance) of the P(Ncg,n ) histogram as a function of the subsequence length n (in log–log scale). Two lines are also drawn for comparison: One is a linear function with slope equal to ρ cg (1 − ρ cg ); the other is a power-law function ∼n 1,5 (c) The third-order moment of the P(Ncg,n ) as a function ofn (in log–log scale). Two lines are also drawn for comparison: One is a linear function with slope equal to ρ cg (1 − ρ cg ) (1 − 2 ρ cg ); the other is a power-law function ∼n 3. d–f are similar toa–c for experimentally confirmed coding sequences.