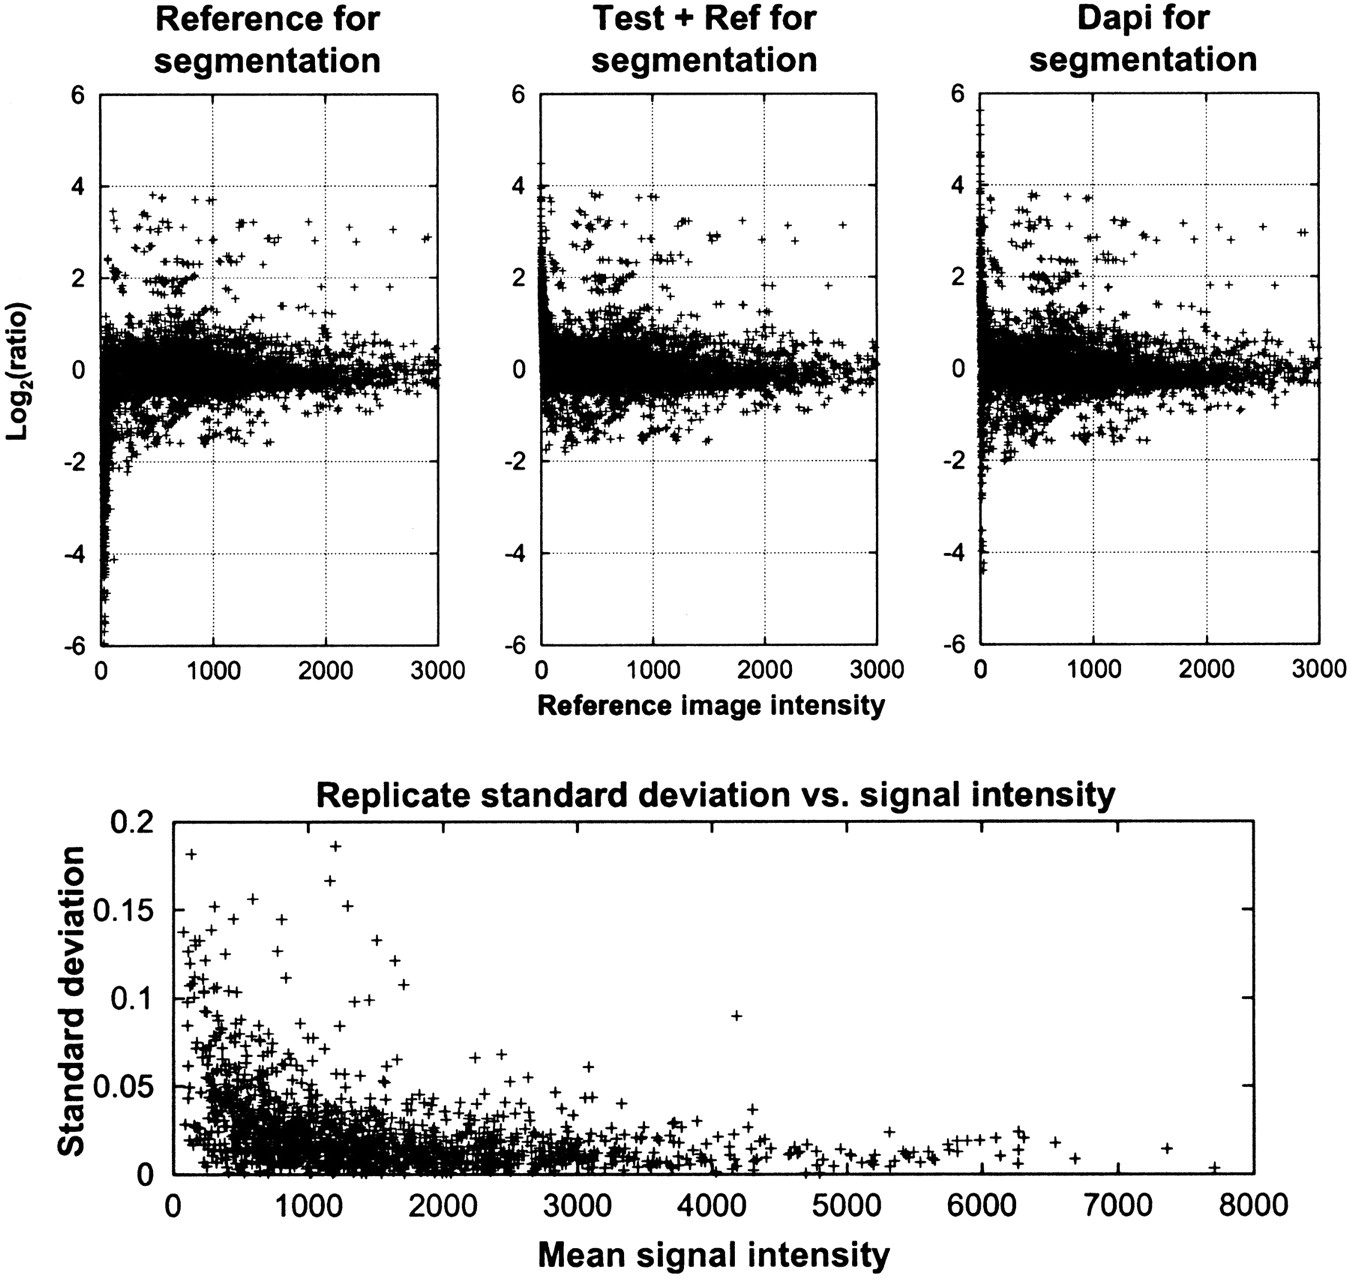
Figure 9.
Top: plots of computed ratio vs. reference signal using three different images for segmentation—reference, composite, and counterstained DAPI. Bottom: plot of replicate standard deviation vs. mean signal (test and reference) intensity using the counterstained DAPI image for segmentation.