Figure 9.
Surface potentials of S. cerevisiae Atx1 and B. subtilis CopZ structures (A). Surface potentials ofS. cerevisiae Ccc2a and B. subtilis CopAa structures (B).
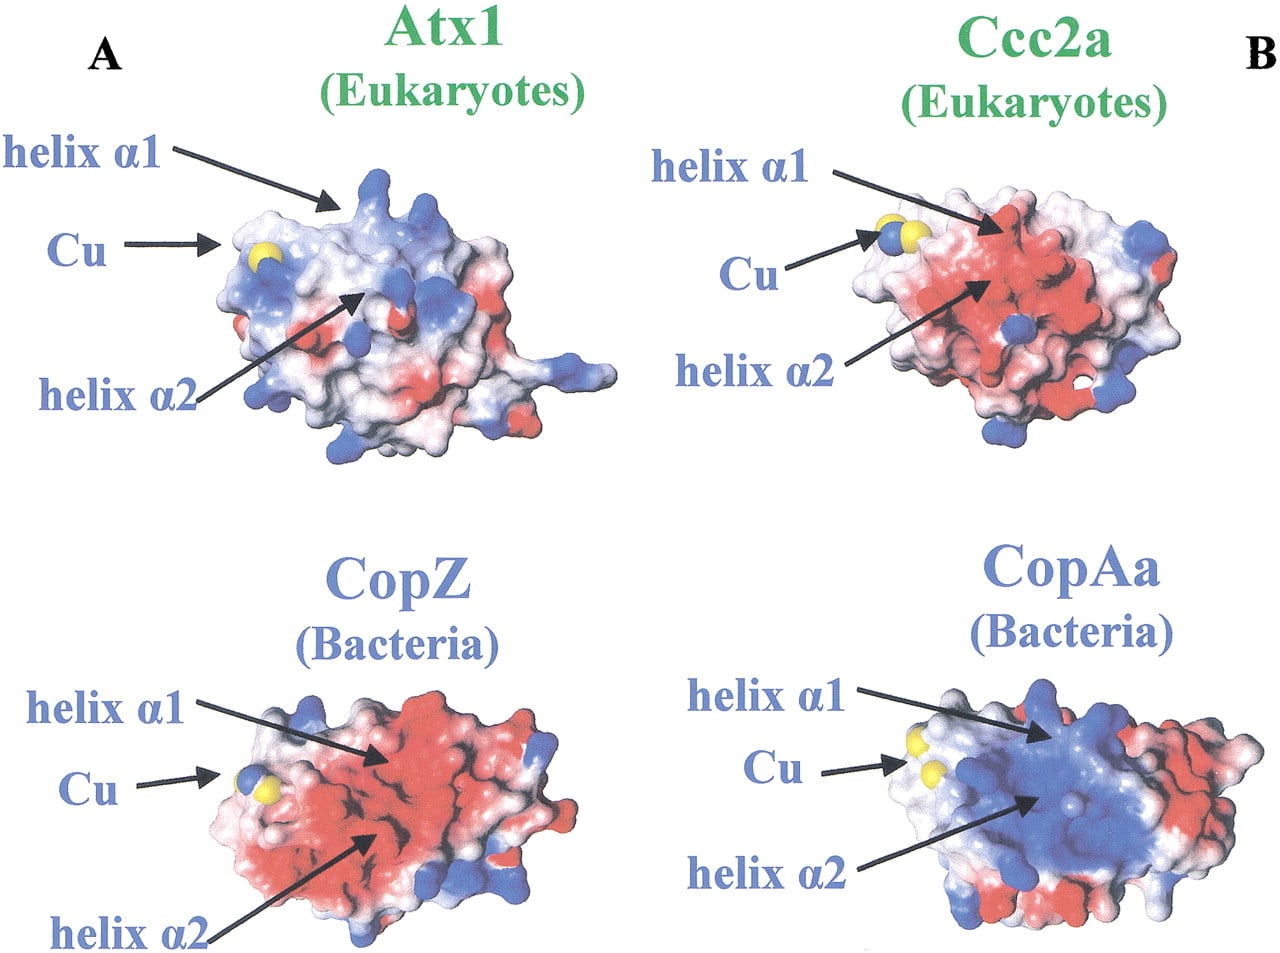
Surface potentials of S. cerevisiae Atx1 and B. subtilis CopZ structures (A). Surface potentials ofS. cerevisiae Ccc2a and B. subtilis CopAa structures (B).