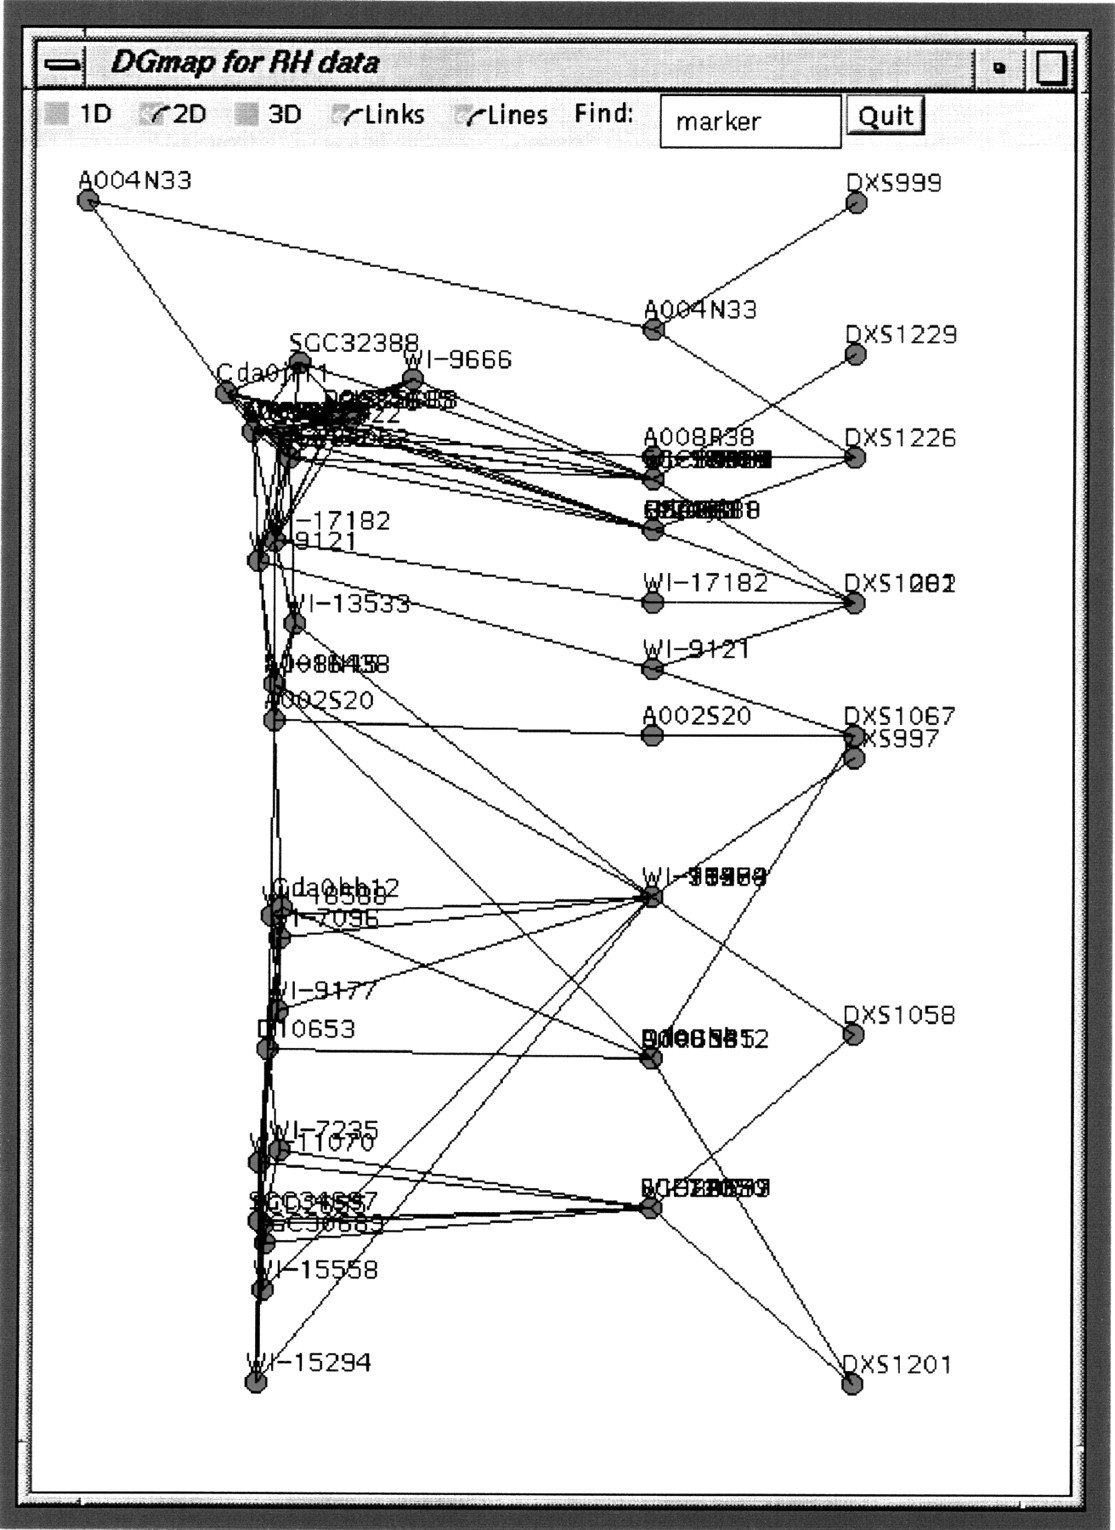
Figure 8.
Printout of a Java applet showing an EST map from the X chromosome. (Left) Map generated here; (middle) markers are placed at the midpoint of their assigned interval in Gene Map (Schuler et al. 1996); (right) the locations of the framework markers on the Genethon genetic map (Dib et al. 1996). Lines between themiddle and right columns indicate the range of the interval to which ESTs have been assigned in Gene Map.