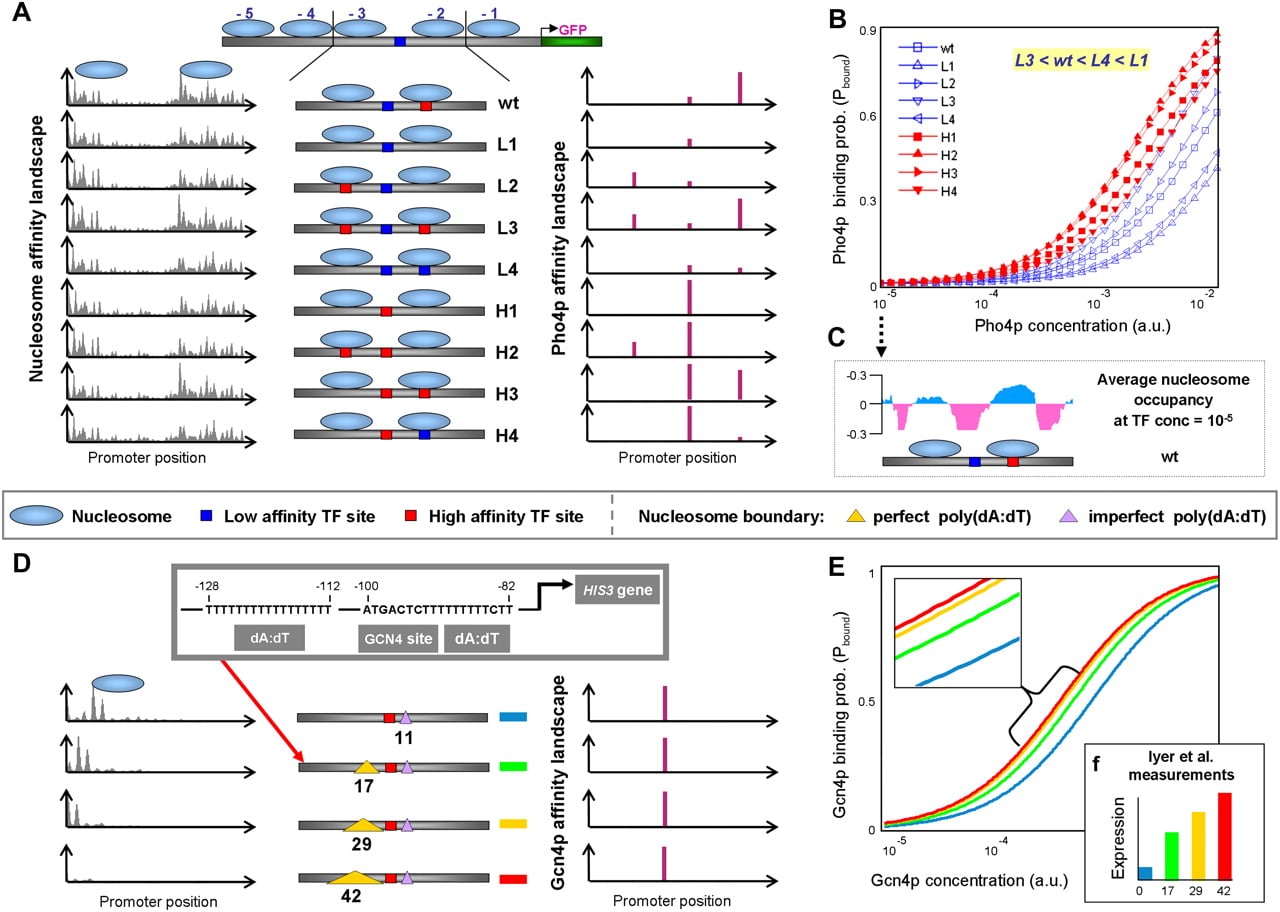
Our model predicts expression behavior of real promoter sequences. (A) Shown are real binding affinity landscapes for each of the PHO5 promoter variants from Lam et al. (2008) (800 bp upstream of the PHO5 gene) (see description in Fig. 2A), generated using the real binding preferences for Pho4p (Lam et al. 2008) and for nucleosomes (Kaplan et al. 2009). For each base pair, the binding affinity landscape displays the likelihood for a bound transcription factor or nucleosome to start at that sequence position. Note that since real sequences are used, unlike in Figure 2, variants L2 and H2 are no longer identical to variants wild type and H3 (respectively), and are therefore included in the analysis. (B) Model prediction of the binding probability of Pho4p, Pbound, generated by applying our thermodynamic framework to each of the promoter variants from A at increasing Pho4p concentrations. The yellow inset indicates the predicted relative ordering of the onset times of the promoter variants with exposed low-affinity sites. Note that here, too, similar to the case when using simplified promoters (Fig. 2), the order predicted is identical to the one measured (see Fig. 2B). (C) Shown is the predicted average nucleosome occupancy (log occupancy divided by the median) at low (10−5) Pho4p concentration for each position along the sequence of the wild-type variant of PHO5. (D) Same as A, but for HIS3 promoter variants constructed by Iyer and Struhl (1995), in which a native 17-bp nonperfect poly(dA:dT) element was either deleted or replaced by a perfect poly(dA:dT) element of length 17, 29, or 42 bp. For each variant, shown are real binding affinity landscapes (intergenic region between the HIS3 gene and the upstream gene MRM1 [also known as PET56]), generated using the real binding preferences for Gcn4p (MacIsaac et al. 2006) and for nucleosomes (Kaplan et al. 2009). (E) Model prediction of the binding probability of Gcn4p, Pbound, generated by applying our thermodynamic framework to each of the promoter variants from D at increasing Gcn4p concentrations. (F) Expression value measurements by Iyer and Struhl (1995) for each of the promoter variants from D.