Figure 8.
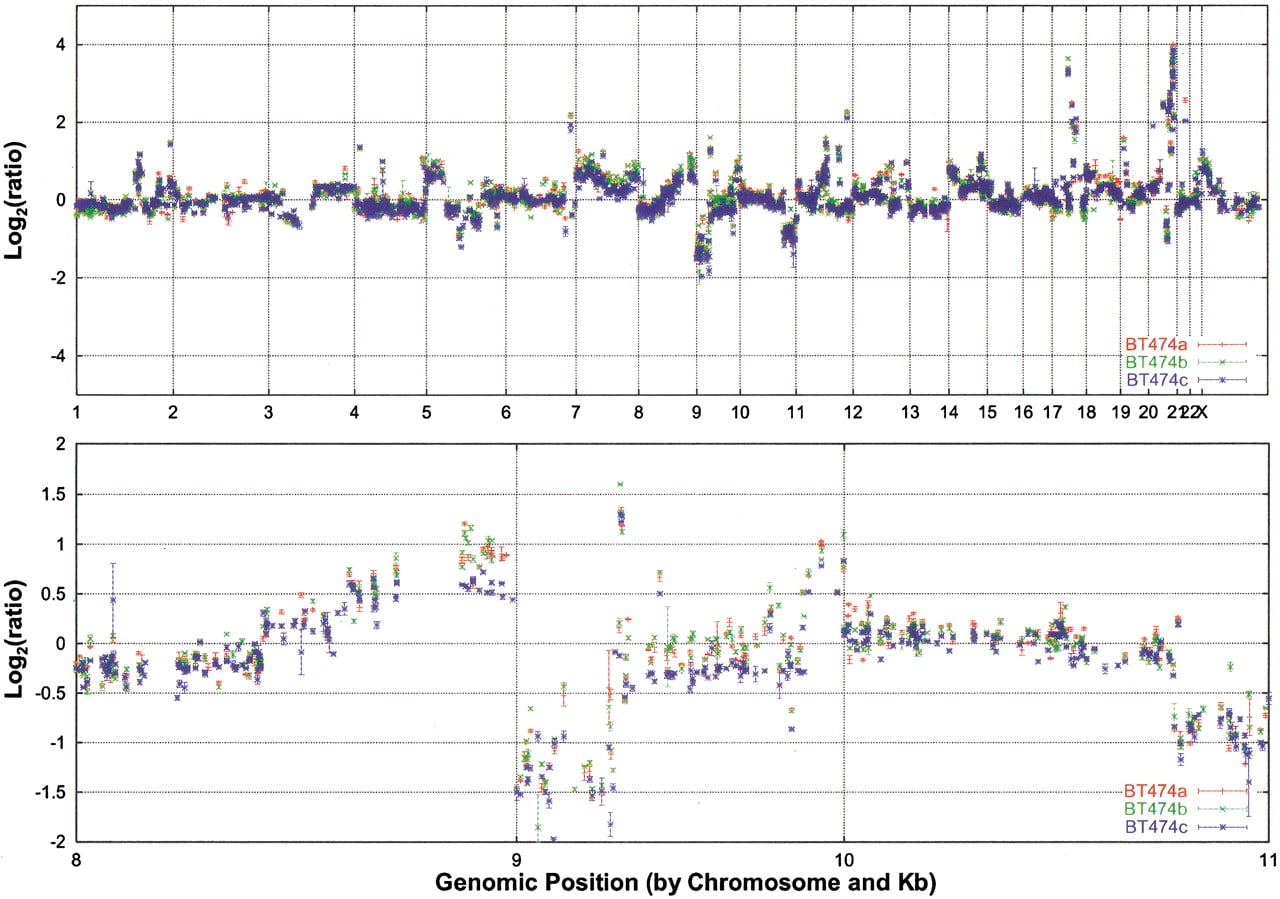
Plot of the final computed ratios for all three hybridizations for clones with standard deviations of the log2 ratios of the triplicate spots less than 0.5. Top: whole genome.Bottom: detailed view of chromosomes 8–10.
Plot of the final computed ratios for all three hybridizations for clones with standard deviations of the log2 ratios of the triplicate spots less than 0.5. Top: whole genome.Bottom: detailed view of chromosomes 8–10.