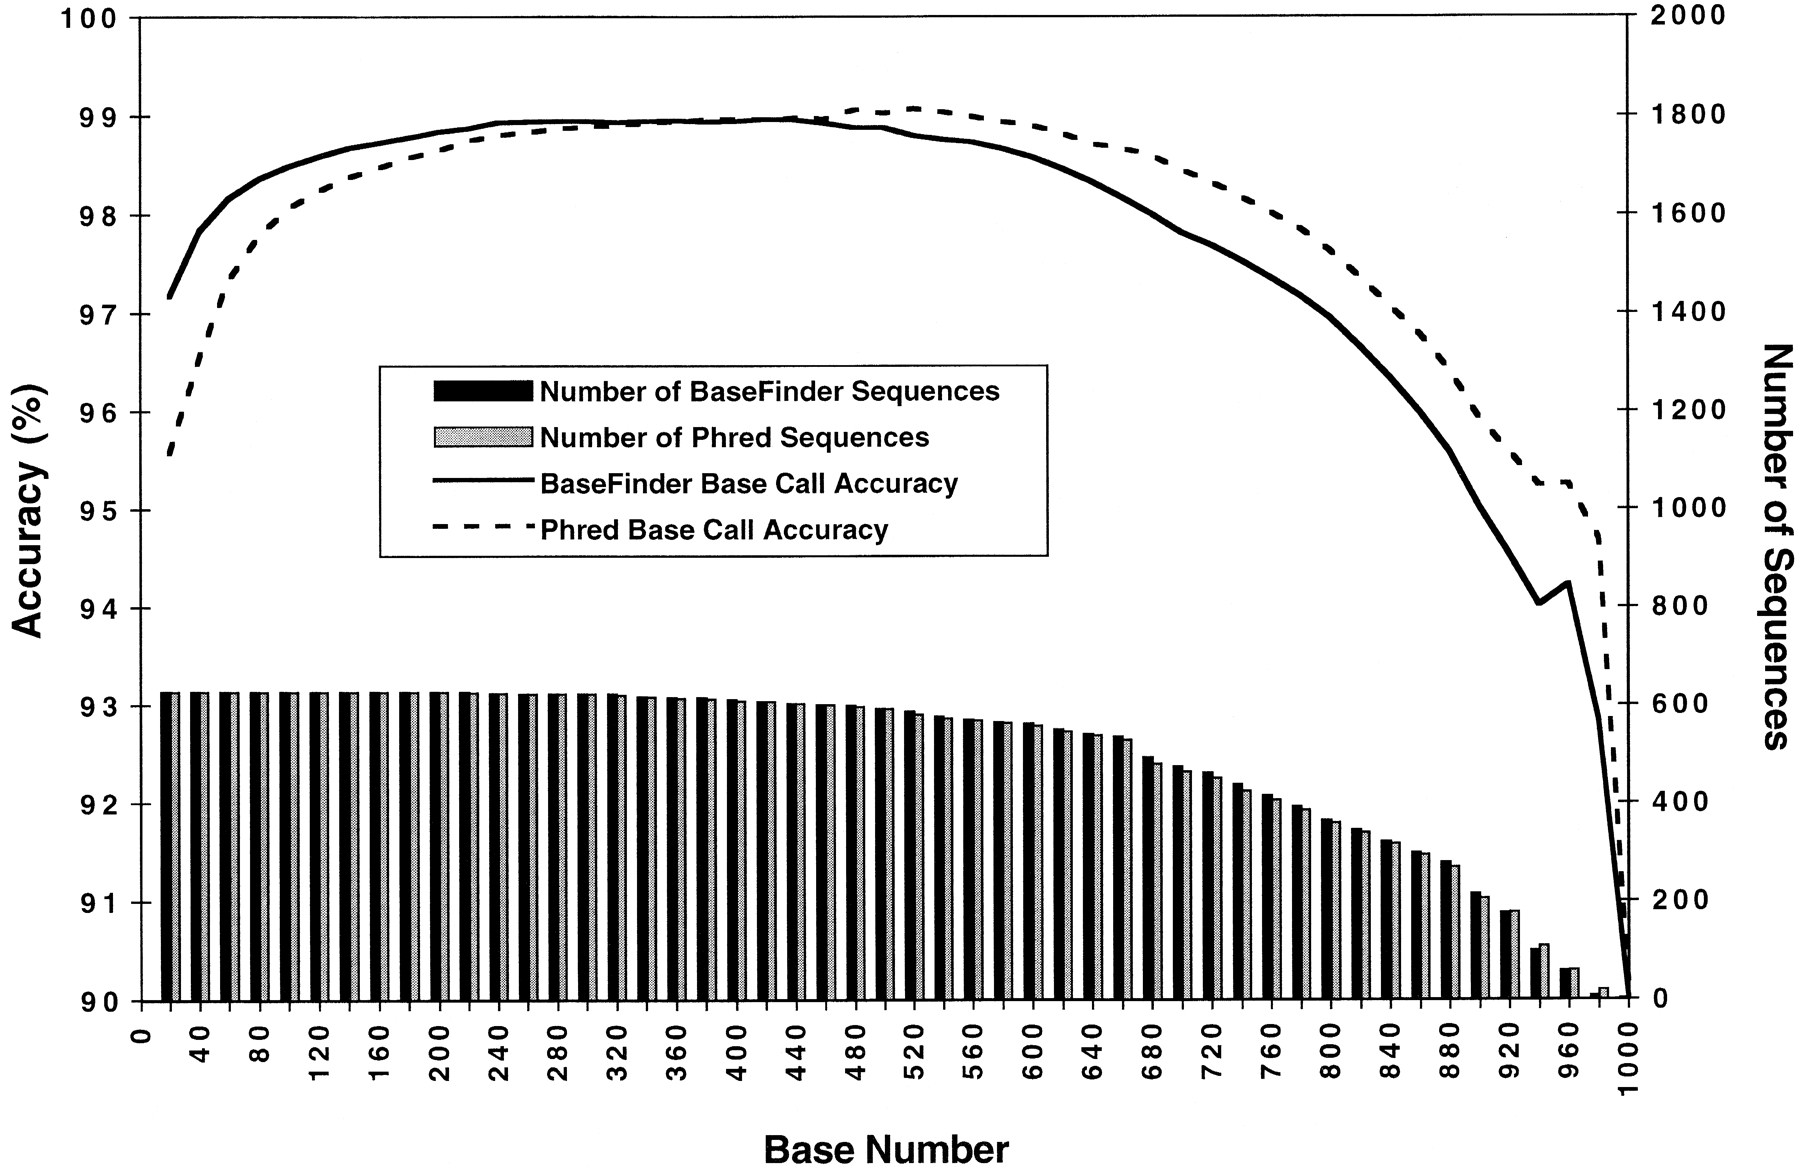
Figure 7.
A plot for averaged accuracy for sequences obtained in sequencing two cosmids from human chromosome 19 using the UW scanner system. Accuracy comparisons for individual sequences were made against the assembled, finished sequence of the cosmids for BaseFinder’s and Phred’s base-calls (both of which used BaseFinder’s preprocessing of the trace data). The line plots represent cumulative accuracy relative to read length for the two cosmids. The bar graphs show the number of sequences long enough to be incorporated into the accuracy calculation for each read length. The y-axis scale on the leftcorresponds to accuracy; the scale on the right to the number of sequences used in calculation of accuracy.