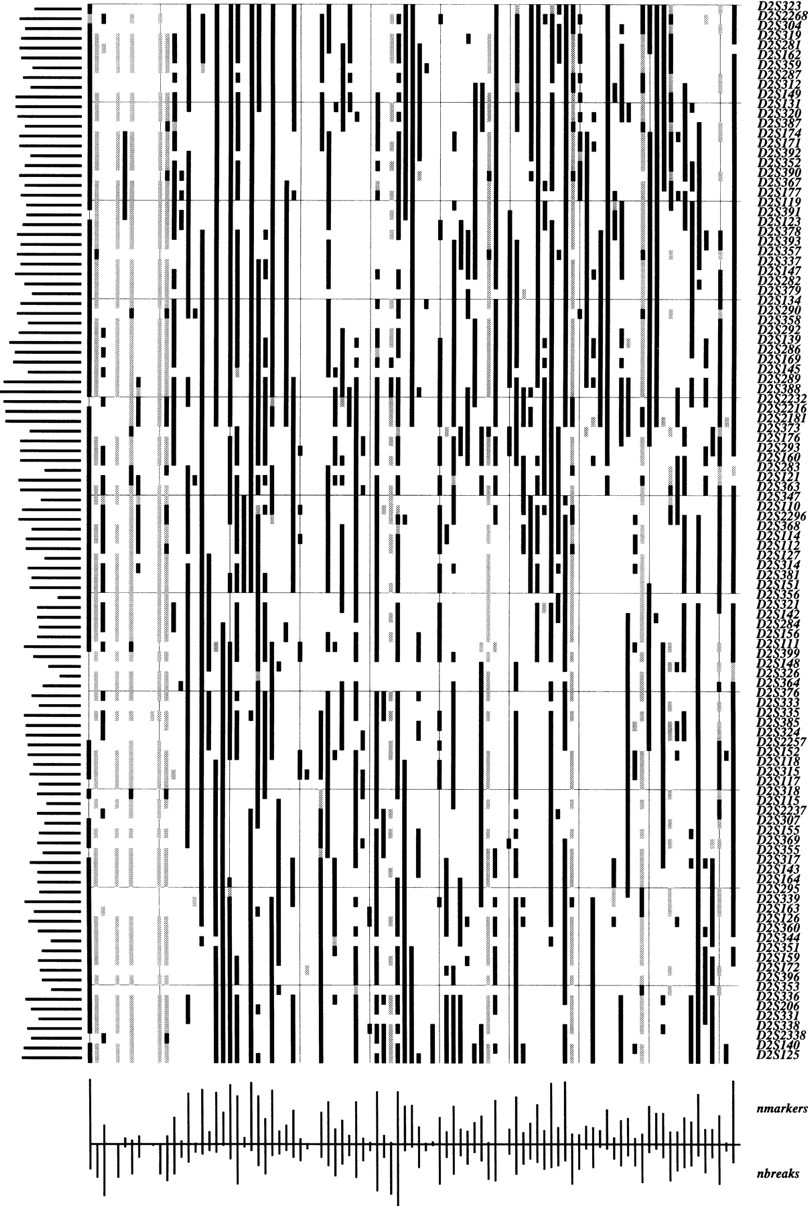
Figure 7.
Raw data for Fig. 6. (Black) Present; (white) absent; (gray) ambiguous/undetermined. Loci are rows from p telomere (top) to q telomere (bottom). Retention frequencies are plotted to the left. Relative numbers of markers and breaks observed in each hybrid cell of the panel are plotted below.