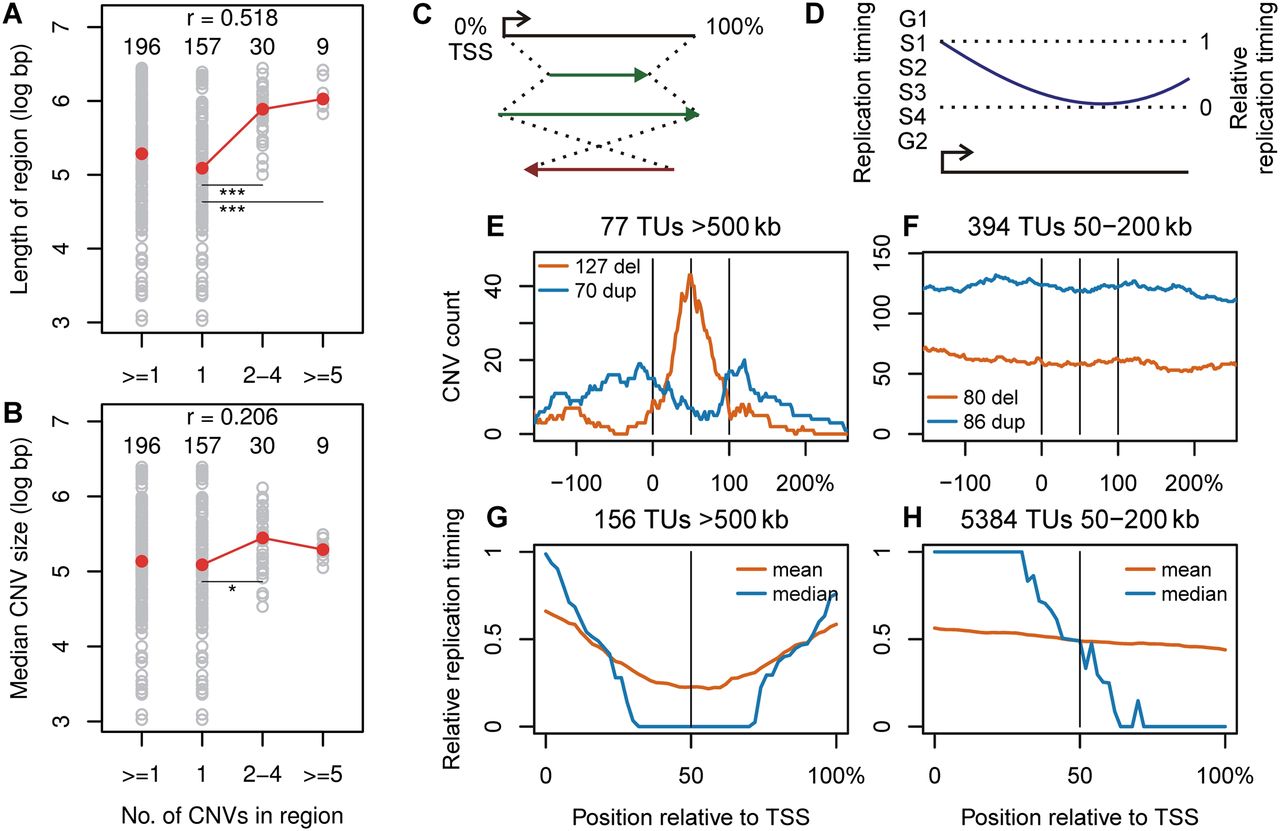
Transcription unit replication dynamics shape CNV size, location, and type. (A,B) Correlation plots of the number of 090 fibroblast CNVs contained in CNV regions vs. the length of the regions and median size of CNVs in the regions, respectively. Individual regions are plotted as gray circles. Red circles are the group medians. The number of regions in each group, Spearman correlation coefficients (r), and significant differences between groups are indicated: (*) P < 0.01; (**) P < 0.001; (***) P < 0.0001. (C) Coordinate transformation used to align TUs according to their endpoints. (D) Transformation of replication timing data from absolute values to ones relative to the minimum and maximum within a TU. (E,F) Sum of 090 CNV counts within and flanking TUs > 500 kb and between 50 and 200 kb, respectively. The y-axis represents the number of CNVs crossing each plotted position. (G,H) Mean and median IMR-90 + BJ relative replication timing by position within 090 TUs > 500 kb and between 50 and 200 kb, respectively. See Supplemental Figures S10 and S11 for mES cell and additional alignment plots.