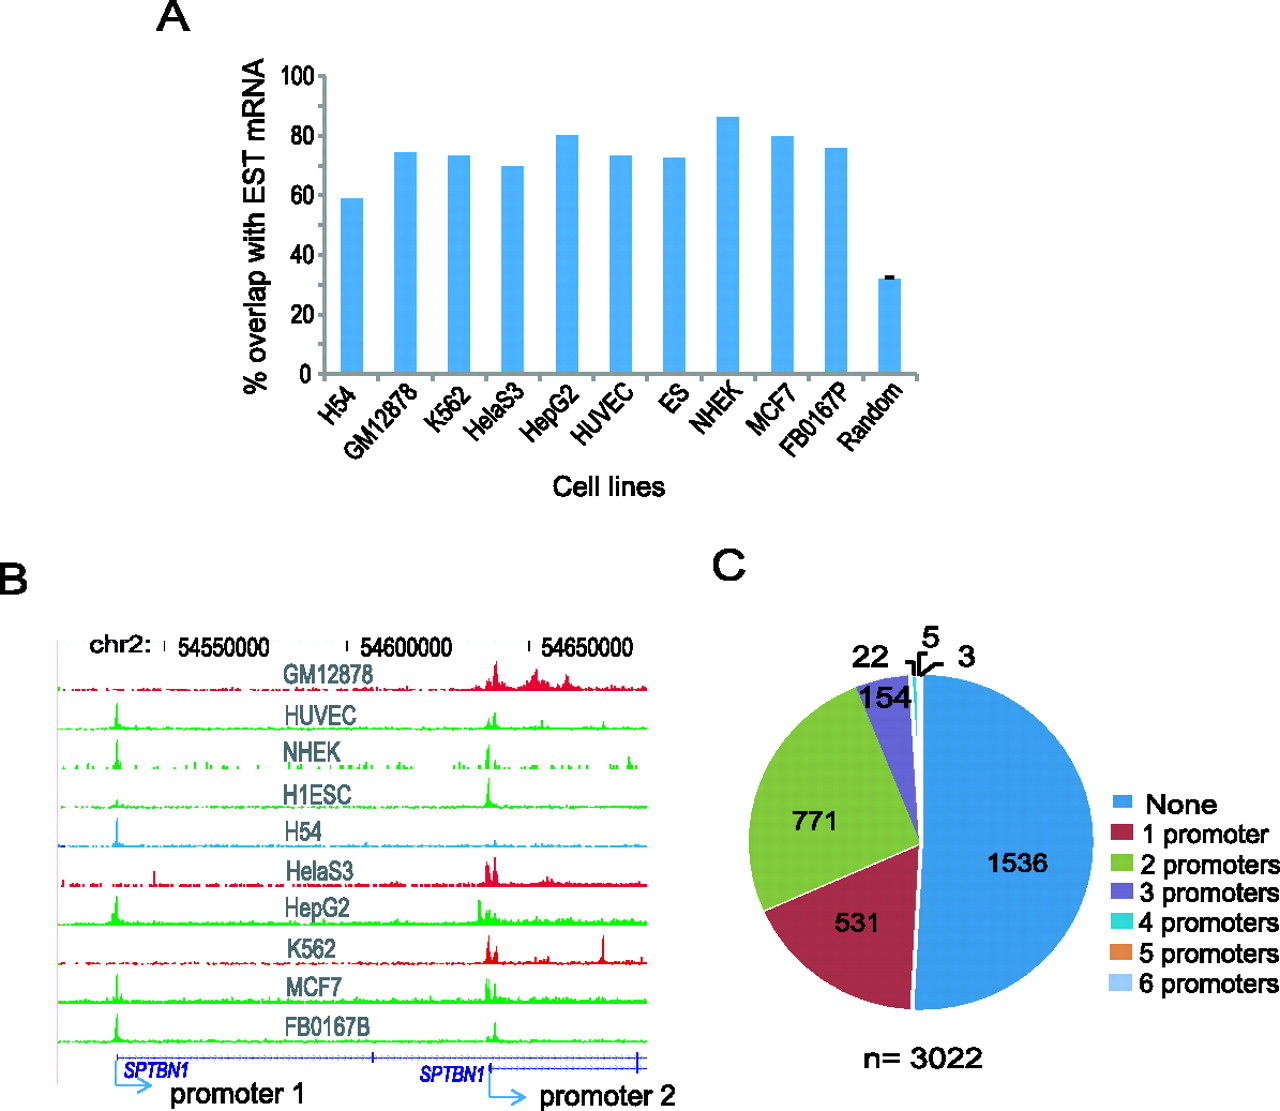
Novel promoters and cell-type specific alterative promoter usage. (A) Percent overlap of RNAPII distal sites with expressed sequence tags (ESTs). The random background control was generated from the average overlap between 10,000 random intergenic loci and ESTs, repeated 10 times and averaged. The small error bar shows the standard deviation for the randomized control. (B) An example of cell-type specific alternative promoter usage is shown in genome browser tracks. Chromosomal coordinates are shown on top and transcripts at bottom. Arrows indicate two TSS locations as well as direction of transcription. Blue, red, and green indicate cell lines using promoter 1, promoter 2, or both promoters, respectively. (C) Pie chart showing the number of genes utilizing different numbers of alternative promoters in K562. “n” indicates the total number of genes having at least two promoters.