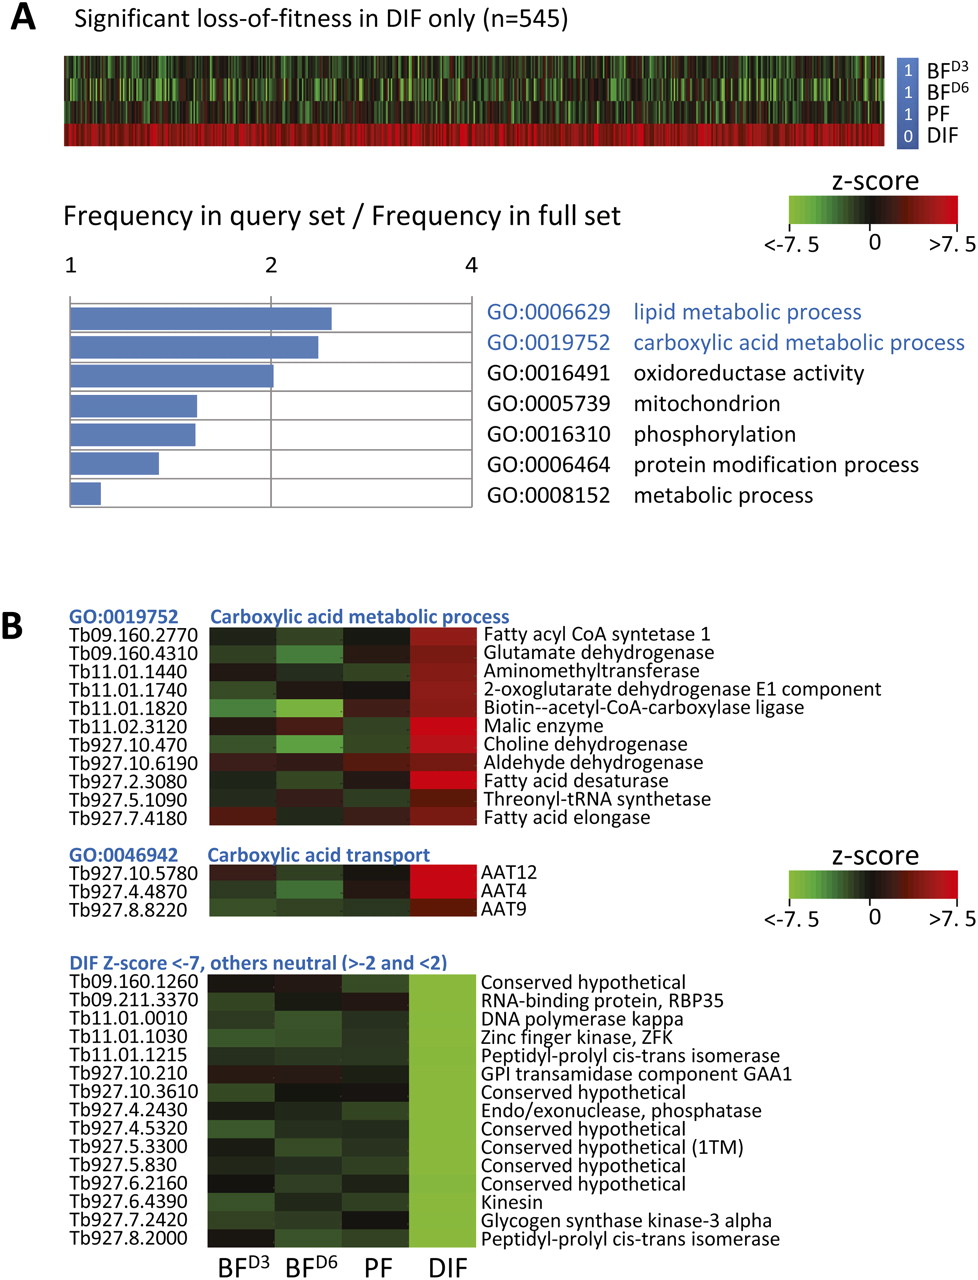
Genetic profile for genes associated with loss-of-fitness only in the differentiation experiment. (A) Genes in the 1-1-1-0 group are presented as a Z-score heat-map above the associated GO-term profile. All significant (P < 0.03) associations from the GO-slim set are shown. See Supplemental File 2 for full GO-term analysis. Terms shown in blue are analyzed in more detail in B or discussed in the text. (B) Examples of cohorts of genes displaying loss-of-fitness (upper panels) or gain-of-fitness (lower panel) associated with differentiation. The upper panels show the genes in the 1-1-1-0 group that are associated with the GO terms “carboxylic acid metabolic process” or “carboxylic acid transport.” (AAT) Amino acid transporter. The lower panel shows the genes with a low Z-score in the DIF experiment (increased reads) but otherwise neutral Z-scores.