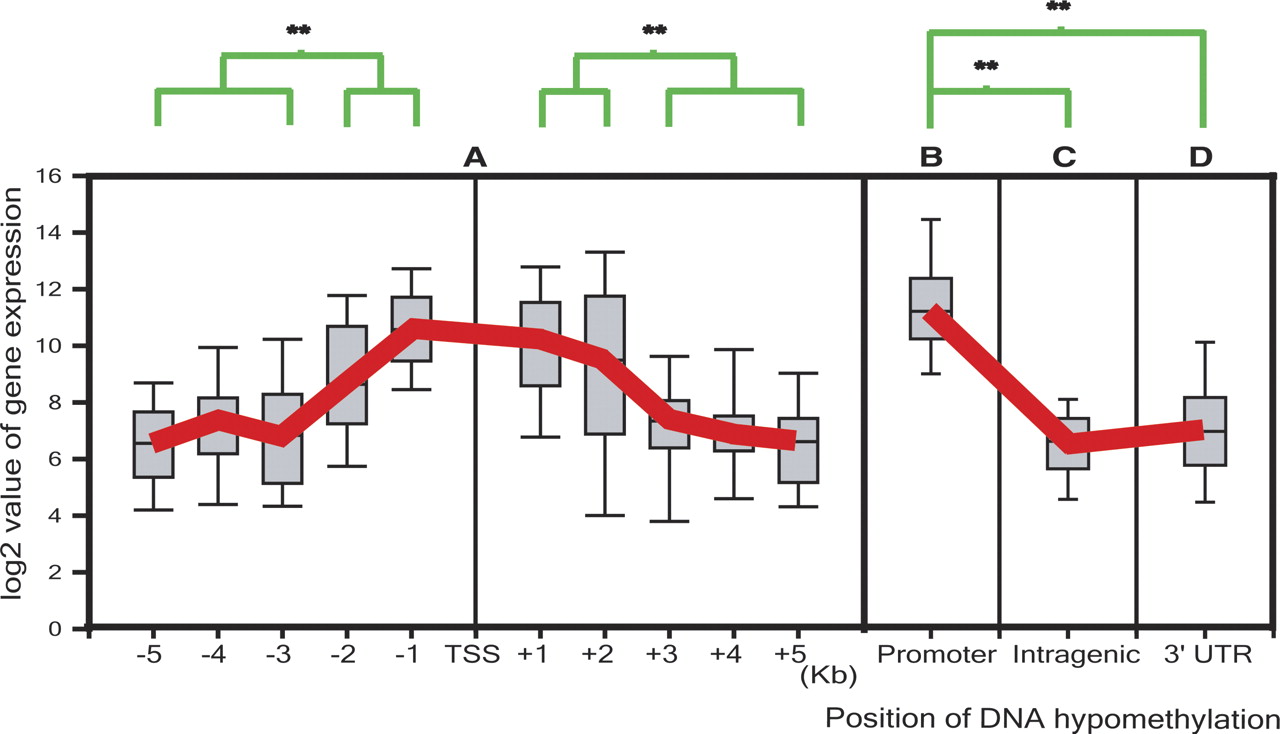
Figure 7.
Box plot of correlation between position of DNA hypomethylation and gene expression. Gene expression level obtained from Affymetrix analysis is correlated with hypomethylated sites at every kb up- or downstream from transcription initiation site. (A) Hypomethylation 2 kb up- or downstream from transcription start site is correlated with higher gene expression (**P < 0.01, t-test). The red line represents the median expression level for each group of genes with hypomethylated sites located 1–5 kb up- or downstream from the transcription start site. (B) Stand-alone promoter has a high level of expression. (C,D) Genes with extensive intragenic hypomethylation and hypomethylation at 3′ UTR show low expression (**P < 0.01, t-test).