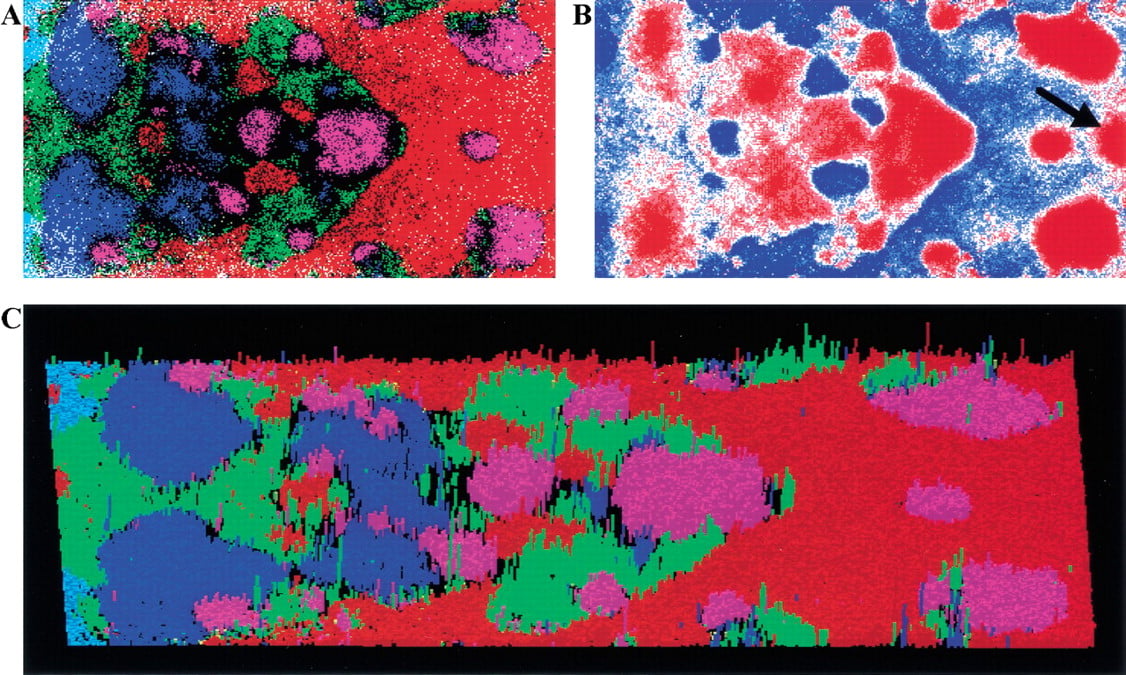
Figure 7.
Di-SOM for 1-kb sequences of six eukaryotes. (A) Di-SOM. Lattices are colored as described in Fig. 4A. (B) CG dinucleotide levels for all weight vectors were calculated and shown as described in Fig. 5. The CG-rich zone in the human territories is noted with an arrow. (C) Three-dimensional presentation of the di-SOM. Number of sequences classified into each lattice that has sequences from a single species is presented with the height of the colored rod.