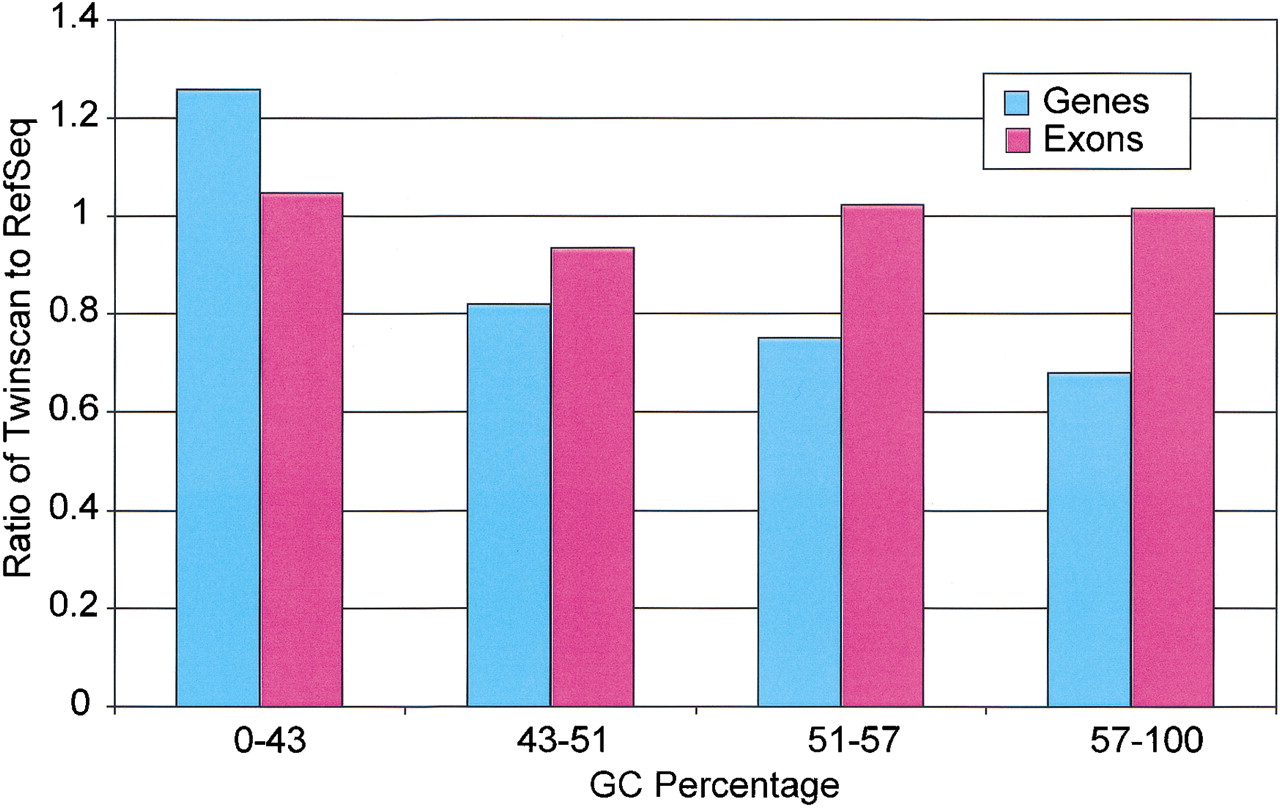
Figure 7.
Fraction of TWINSCAN exons (genes) in each GC bin divided by the fraction of RefSeq exons (genes) in the same bin. Bars above 1.0 represent over-prediction and those below 1.0 represent under-prediction. TWINSCAN tends to predict genes with fewer exons in areas of lower GC content.