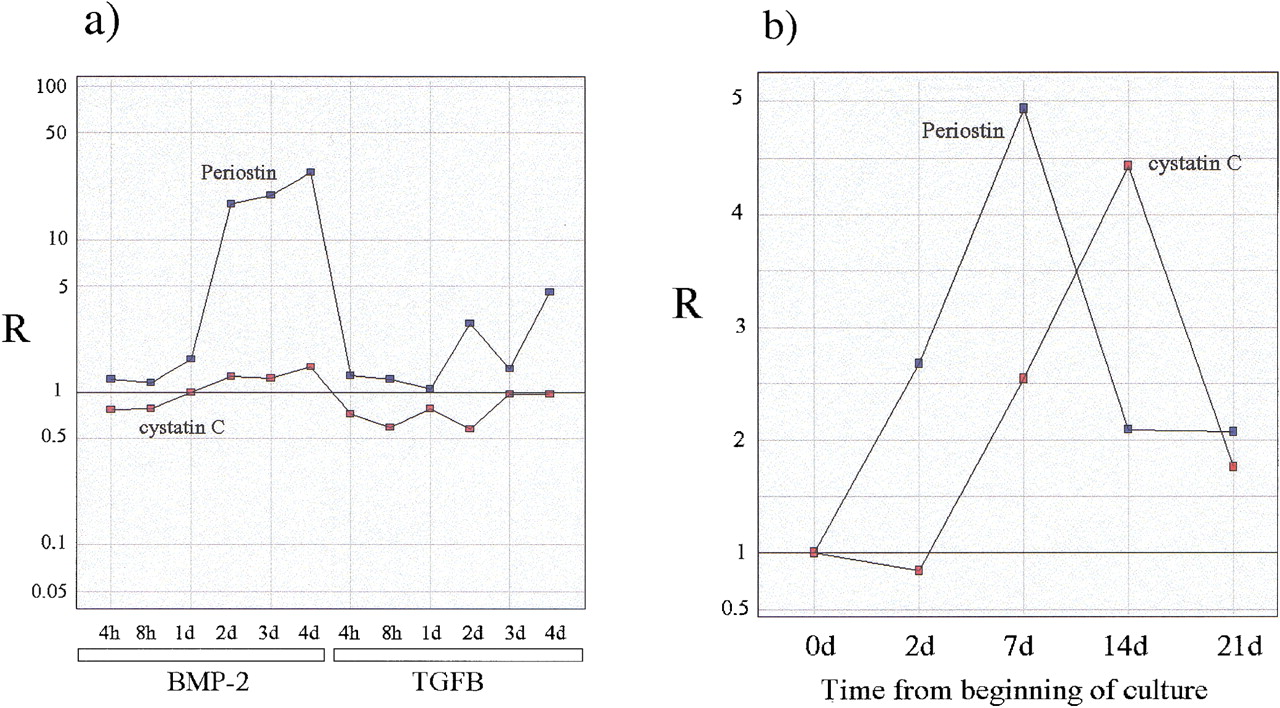
Figure 7.
Expression profiles for periostin (Osf-2) and cystatin C. (a) Ratios of expression in the treated to expression in the control samples for the two C2C12 time courses under treatment with BMP-2 and TGFB; (b) ratios of expression relative to the first time point for the time course generated by the calvaria primary cell culture.