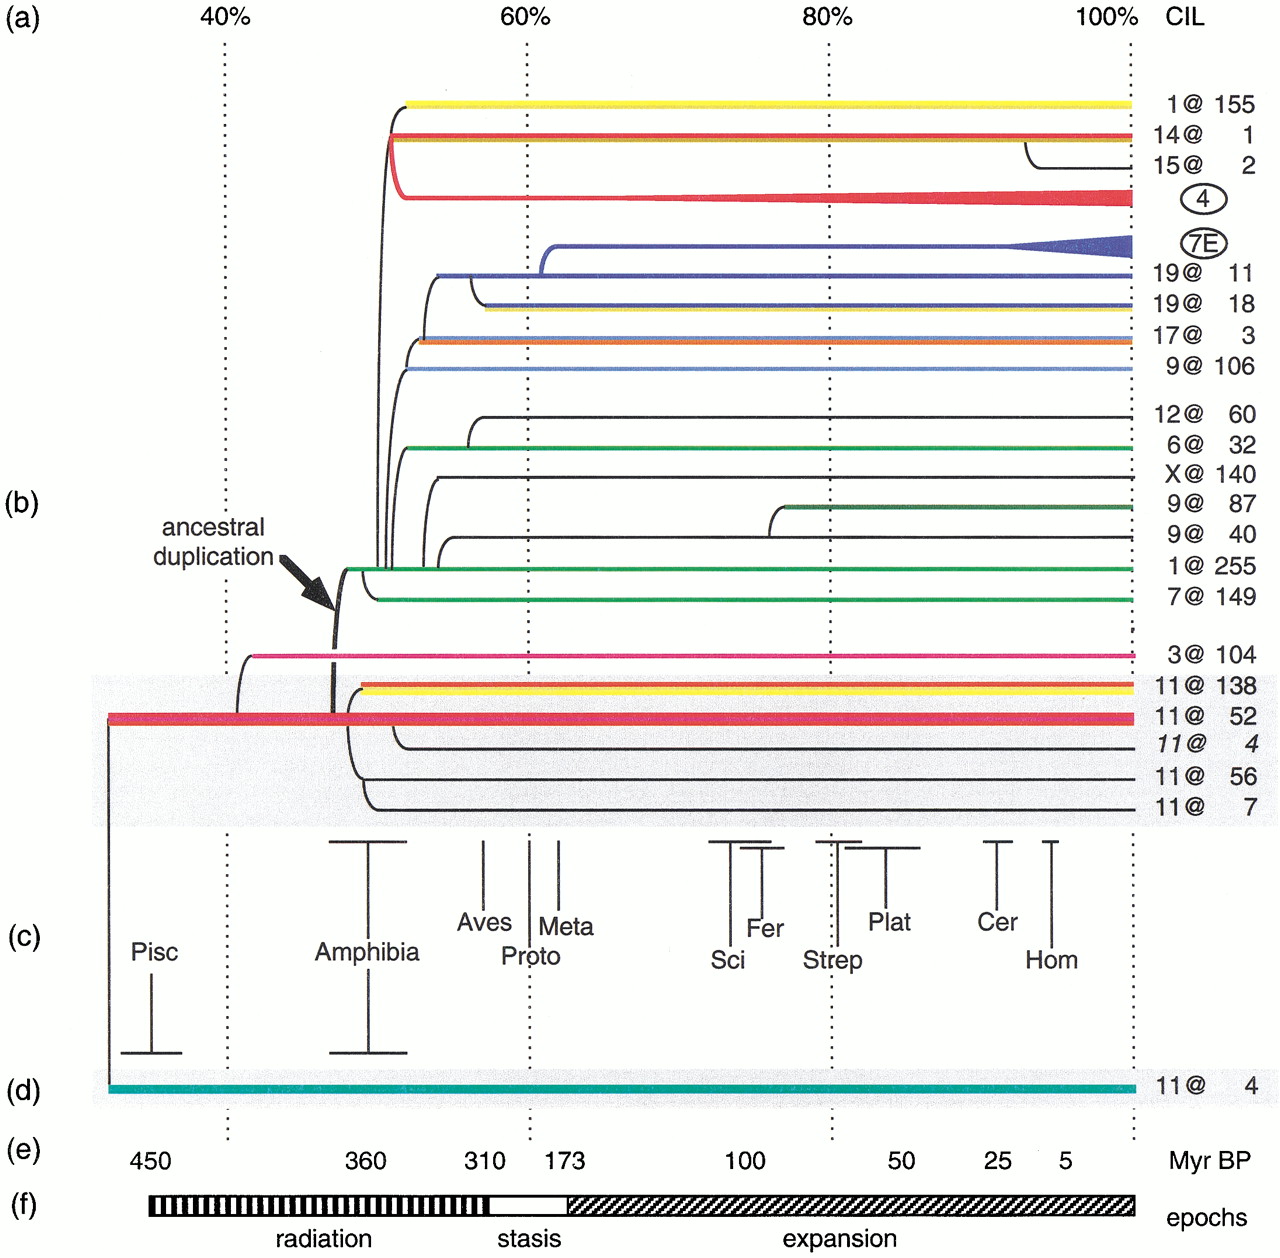
Comparative cluster analysis and OR molecular clock. (a) Cluster identity level (CIL) scale. (b) Dendrogram of duplicating clusters including Class II ORs. Clusters are named by using the “chromosome@Mb coordinate” nomenclature. Circled “4” and “7E” indicate the radiation of OR genes and clusters of family 4 (including clusters 9@71 and 3@136) and subfamily 7E (including clusters 6@186 and 19@63). Branches are colored according to the family (or families) that expanded most in each cluster (color key as in Fig. 1). A gray background highlights clusters on chromosome 11. The arrow indicates the ancestral duplication event that started the OR cluster radiation. 11@4represents here only the Class II section of the 11@4 cluster. (c) Taxonomical groups of the nonhuman species studied, including: Pisc(es): fish species; Amphibia: frogs, salamander; Aves: chick; Proto(theria): platypus; Meta(theria): koala; Sci(urognathi): marmot, mouse, rat; Fer(ungulata): pig, dolphin, dog; Strep(sirrhini): lemurs, squirrel monkeys; Plat(yrrhini): marmoset; Cer(copithecidae): baboon, macaques; Hom(inidae): chimpanzees, gorilla. Horizontal bars indicate the range of average PIDs when more than one species is included in the taxonomical group. (d) The single cluster containing Class I ORs. (e) Timescale in million years before present (Myr BP). (f) The three epochs of OR evolution.