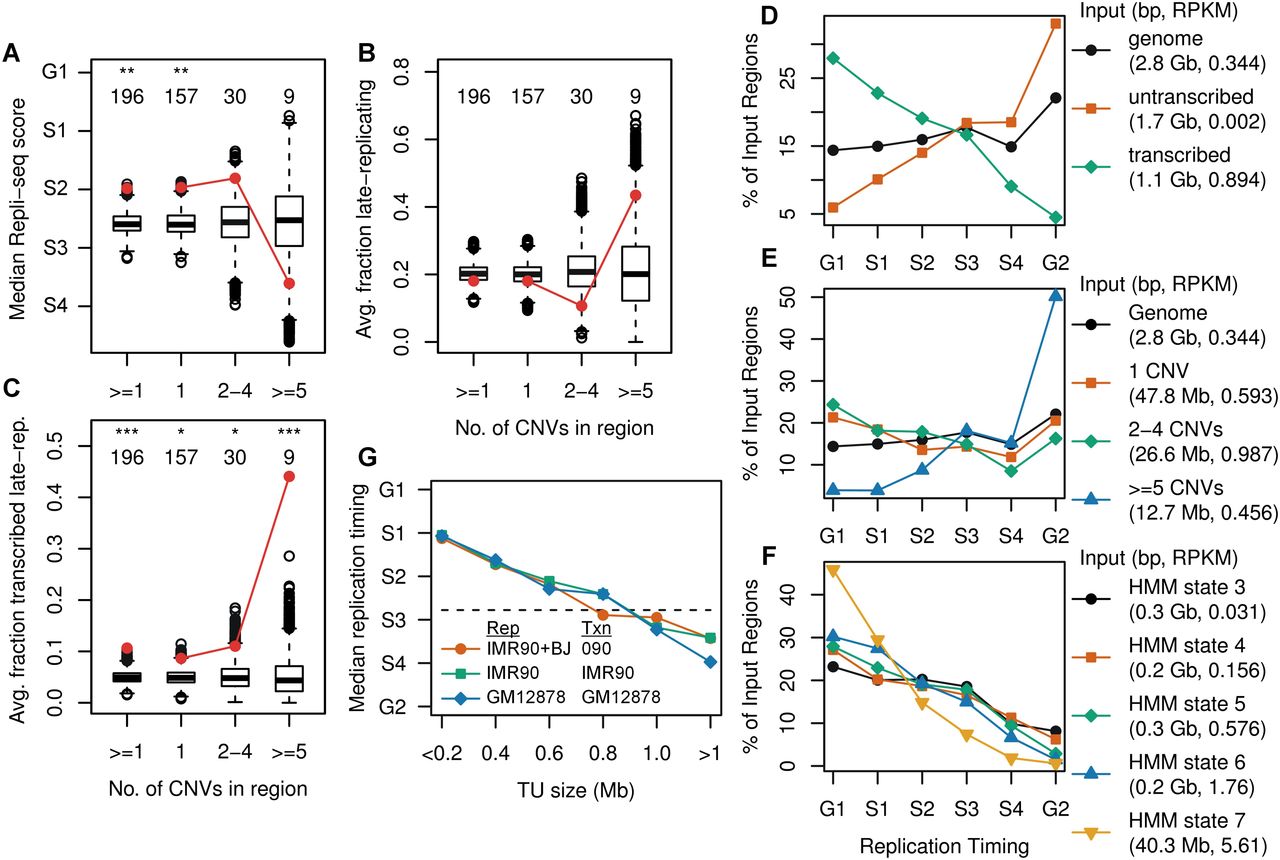
CNV clustering extent stratifies by replication timing. (A–C) Human 090 fibroblast CNV region enrichment plots for the average replication timing in IMR-90 + BJ Repli-seq data, fraction in late-replicating segments, and fraction in the transcribed portions of late-replicating segments, respectively. (D) Distribution of replication timing for the entire genome as well as the transcribed and untranscribed portions of the genome, based on 090 Bru-seq and IMR-90 + BJ Repli-seq data. The legend indicates the aggregate size and Bru-seq RPKM of all input genome regions contributing to each trace. Each trace sums to 100% of its input regions. (E,F) Replication timing plots for CNV region groups and the transcribed portion of the genome stratified by transcription intensity, respectively. (G) Median replication timing for all TUs stratified into 200-kb size bins for different paired Repli-seq (Rep) and Bru-seq/GRO-seq (Txn) samples. A horizontal line indicates the IMR-90 + BJ genome median. See Supplemental Figures S7 and S8 for mES cell and additional enrichment plots.