Figure 6.
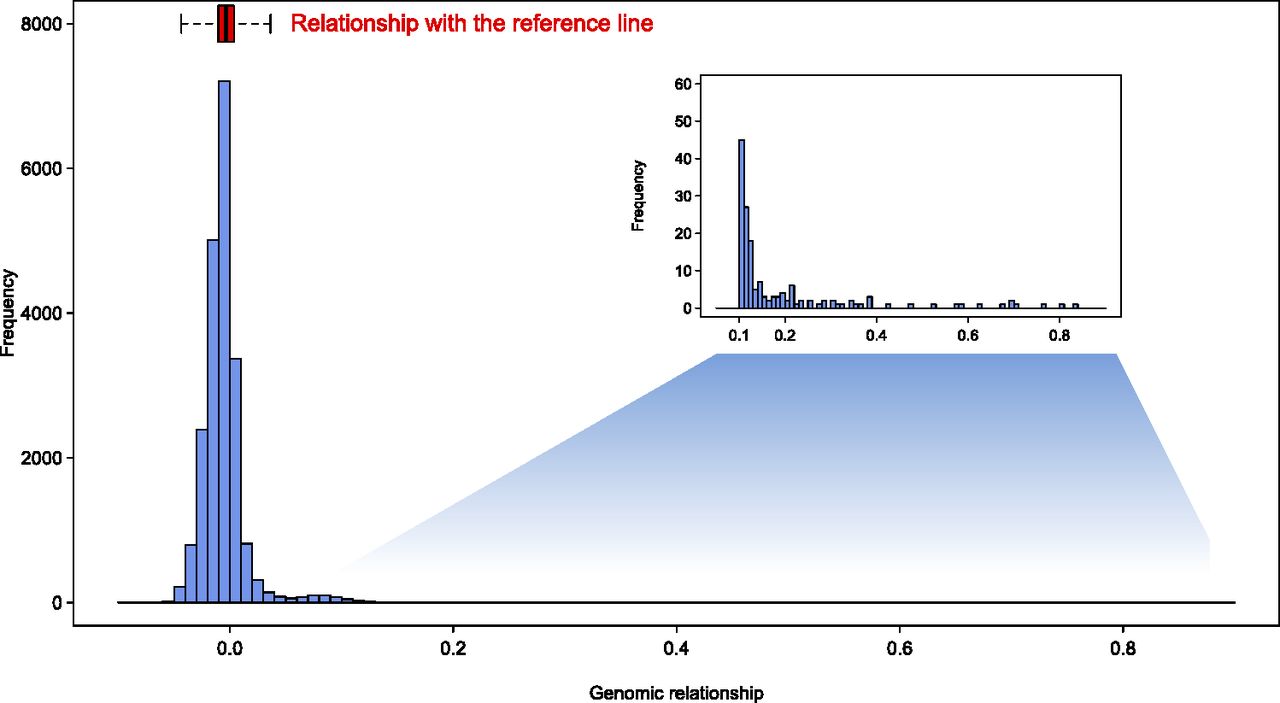
Histogram of genomic relationships among DGRP lines (20,910 possible pairs). The distribution of the relationship between all DGRP lines and the reference sequence is displayed as a box plot.
Histogram of genomic relationships among DGRP lines (20,910 possible pairs). The distribution of the relationship between all DGRP lines and the reference sequence is displayed as a box plot.