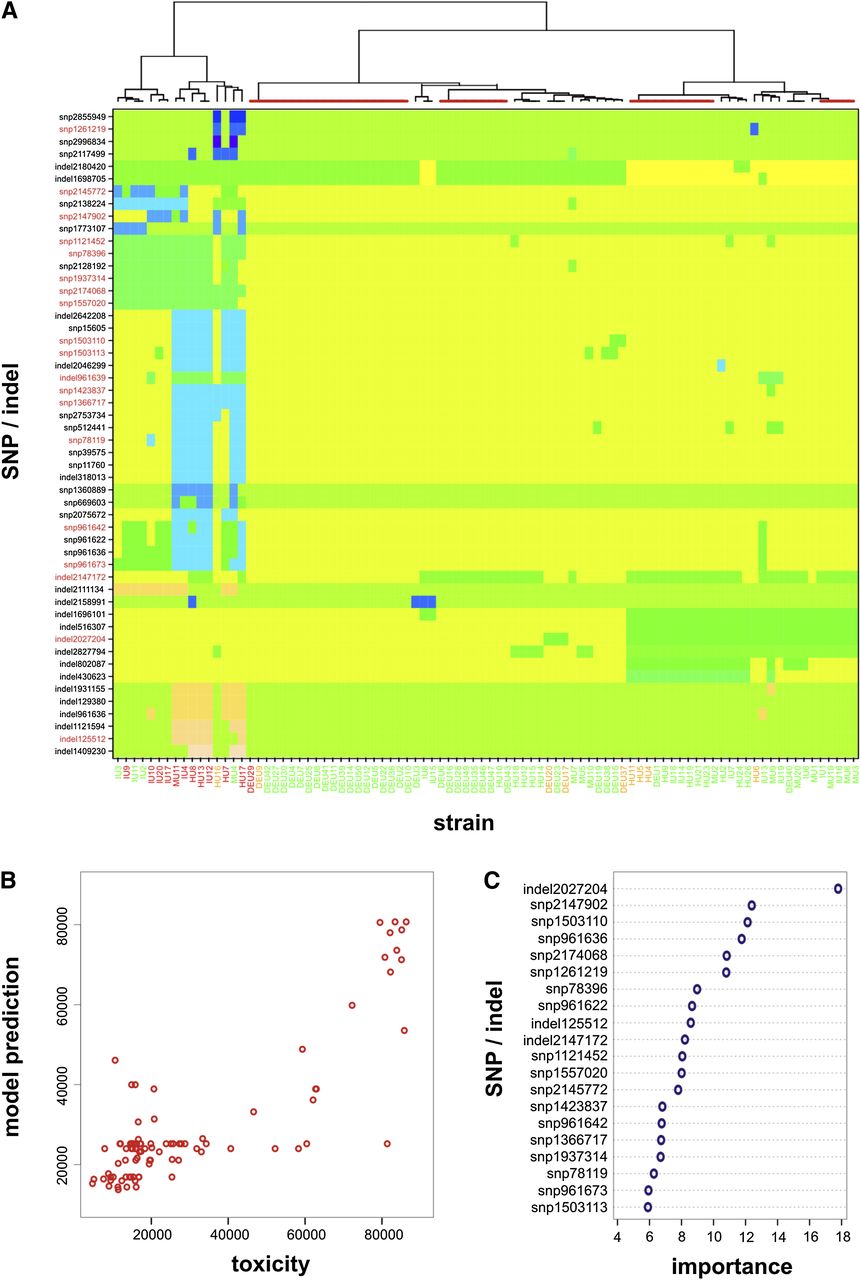
Genetic signatures affecting the toxicity of MRSA isolates. (A) Unsupervised hierarchical clustering analysis of significant SNPs/indels affecting toxicity in 90 isolates of the MRSA lineage ST239, color-coded (along the bottom) according to toxicity classes: low (green, <35,000), medium (orange, <65,000), and high (red, >65,000). Where an isolate has either the reference sequence at a site or the SNP/indel is illustrated as a change in block color across the rows. The most highly toxic strains are found to cluster together, indicating similar signatures independent of genetic background. Clusters highlighted by red bars on top denote strains with identical SNP/indel signatures. SNPs and indels highlighted in red (on the left-hand side) are those found to have high importance for the predictive model. (B) Random forest regression analysis shows a good fit between the strains’ observed level of toxicity and those predicted by the model; most outliers belong to clusters of identical strains, which cannot be resolved by these SNP/indel signatures. (C) Top 20 SNP and indels with highest influence on class prediction error, ordered by descending degree of importance.