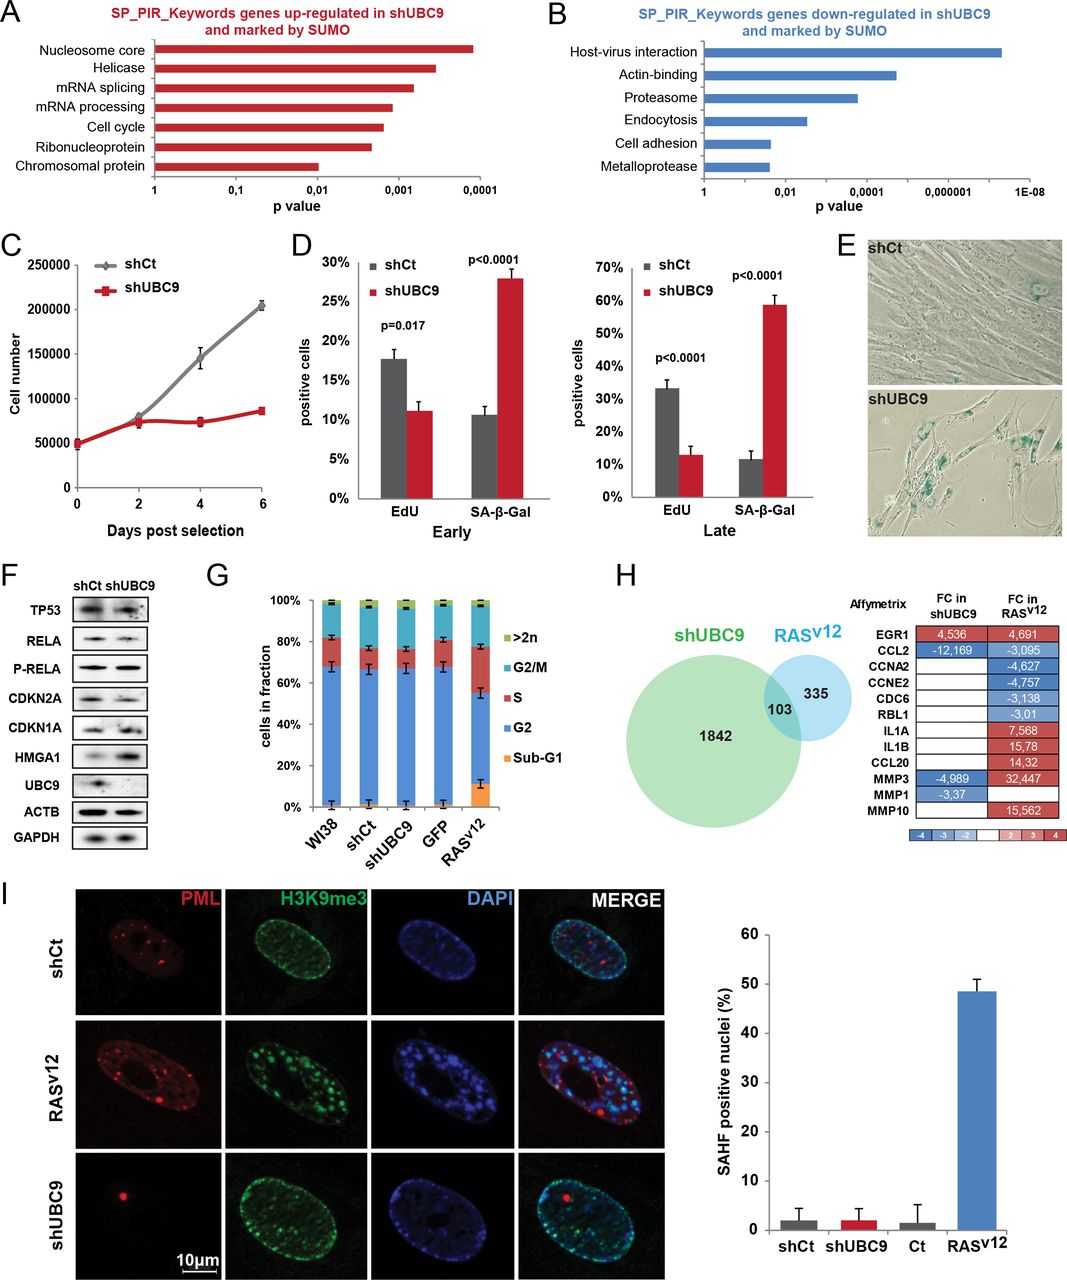
Depletion of UBC9 induces altered gene expression program together with a senescence-related phenotype. (A,B) Top selected categories identified by DAVID ontology analysis of up-regulated (A) and down-regulated (B) genes marked by SUMO1 and/or SUMO2 in their promoters in shUBC9 WI38 cells. (C) Growth curve of WI38 cells following infection with lentiviruses expressing shCt or shUBC9 shRNAs. (D) Percentage of EdU and SA-β-Gal positive WI38 cells at 4 d (early) and 8 d (late) post-infection. (E) Representative micrographs showing SA-β-Gal staining. (F) Western blot analysis of shCt or shUBC9 WI38 extracts for the indicated senescence markers. Actin and GAPDH were used as loading controls. (G) WI38 cells infected with lentiviruses expressing shCt, shUBC9, GFP, or HRASG12V were stained with propidium iodide and subjected to cell cycle analysis by flow cytometry. (H) Venn diagram showing overlap between Affymetrix gene expression profiles of HRASG12V-induced senescent and shUBC9 WI38 cells. Heat map below represents fold changes (FC) of selected genes in the two data sets. (I) Immunostaining of WI38 infected cells with control shCt, shUBC9, or HRASG12V as indicated and stained for PML (red), H3K9me3 (green), and DAPI for SAHF visualization. The unique PML aggregate in the shUBC9 cells is used as a positive control for knockdown efficiency (Zhong et al. 2000). (Right) Graph presenting the associated percentages of SAHF positive nuclei.