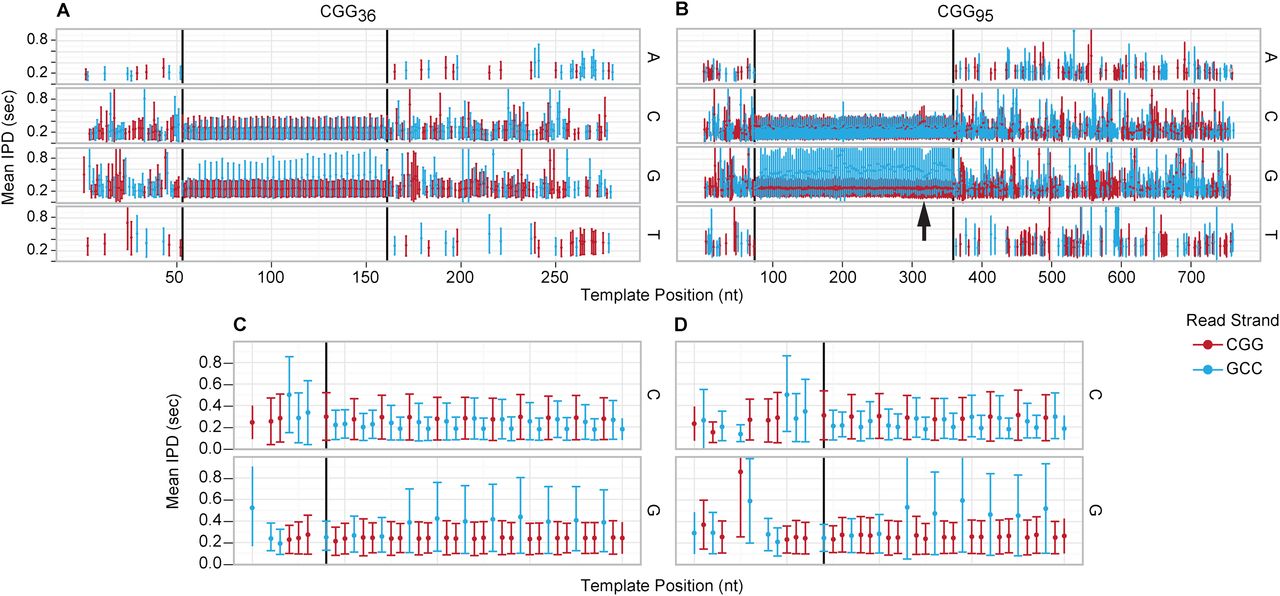
Time-domain analysis with mean IPD values faceted by base, colored according to the strand being synthesized (CGG, red; GCC, blue), and synchronized by aligned template position. (Error bars) SD from 200 reads. Vertical black lines demarcate the start and end of the repeat region per sample. The IPD, as illustrated in Figure 1, is the time interval from the end of the previous incorporation pulse to the start of the current incorporation pulse. (A,C) 36-mer sample shows an increased G IPD inside the repeat region only for the GCC strand. (B,D) 95-mer sample with the same increased G IPD only for the GCC strand, with a dip localized to an AGG interruption (arrow). (C,D) Expanded view of the start of the repeat region for both 36-mer (C) and 95-mer (D) reveals that the IPD increase begins at the fourth CGG repeat.