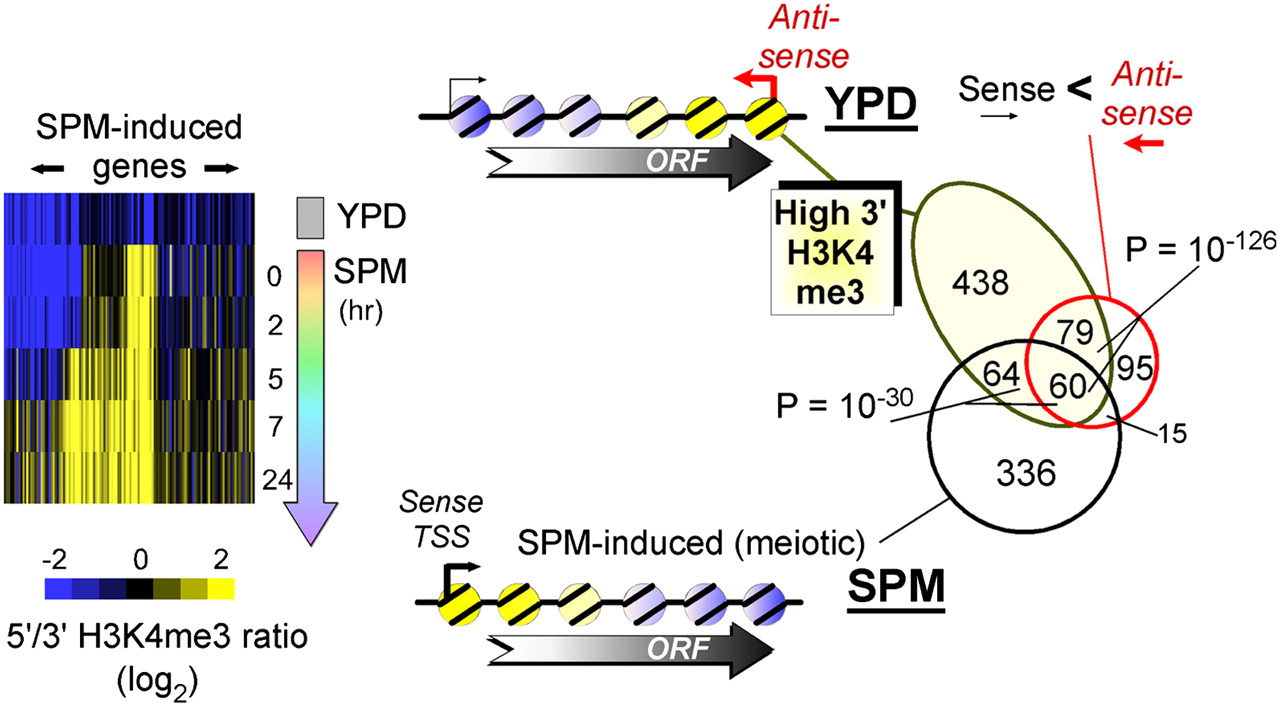
H3K4me3 provides a signature of repressive antisense transcription. The ratio of H3K4me3 density at the 5′ end to the 3′ end of every gene was calculated. The intersecting genes of meiotic specific genes and the genes having log2 ratios that were negative at rich media were selected and k-means (k = 3) clustered (n = 124). The cluster plot is shown on the left and is turned 90° from the normal orientation. Genes are columns, rows are time points, and blue/black/yellow color scale reflects the log2 5′/3′ ratio. The top Venn diagram shows the overlap between these genes and those that produce greater antisense than sense transcription (Parkhomchuk et al. 2009). The bottom Venn diagram shows the overlap with sporulation-induced genes (Chu et al. 1998). χ-test P-values are shown.