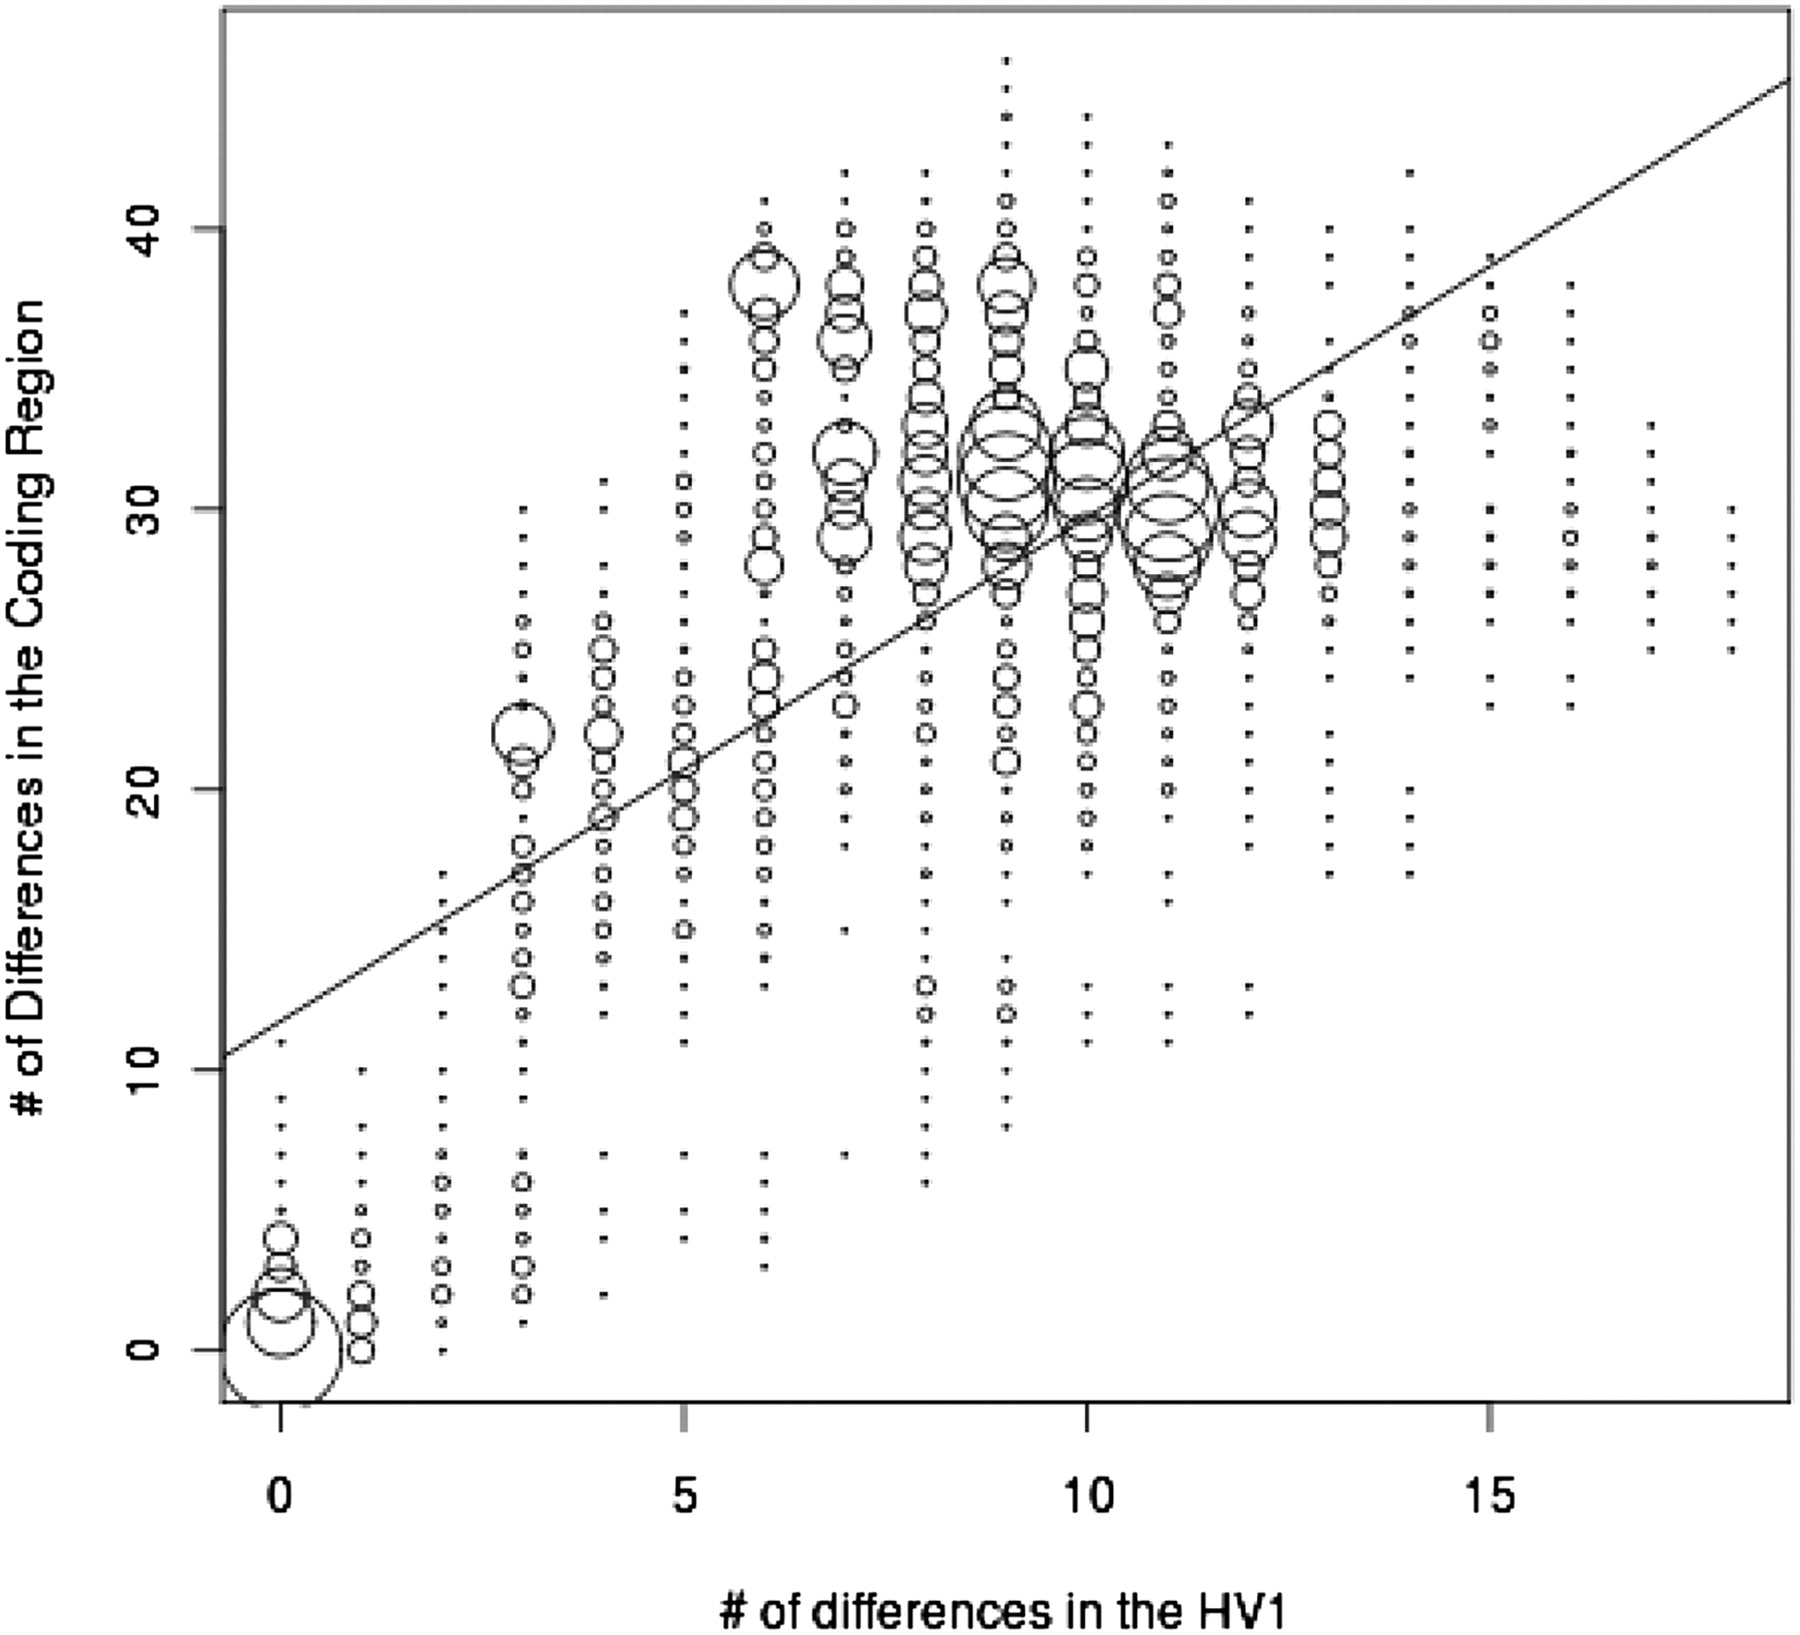
Figure 6.
Plot of the number of differences in the HV1 sequences versus the number of differences in the coding region sequences for each pair of individuals. The best-fit line is indicated.
Plot of the number of differences in the HV1 sequences versus the number of differences in the coding region sequences for each pair of individuals. The best-fit line is indicated.