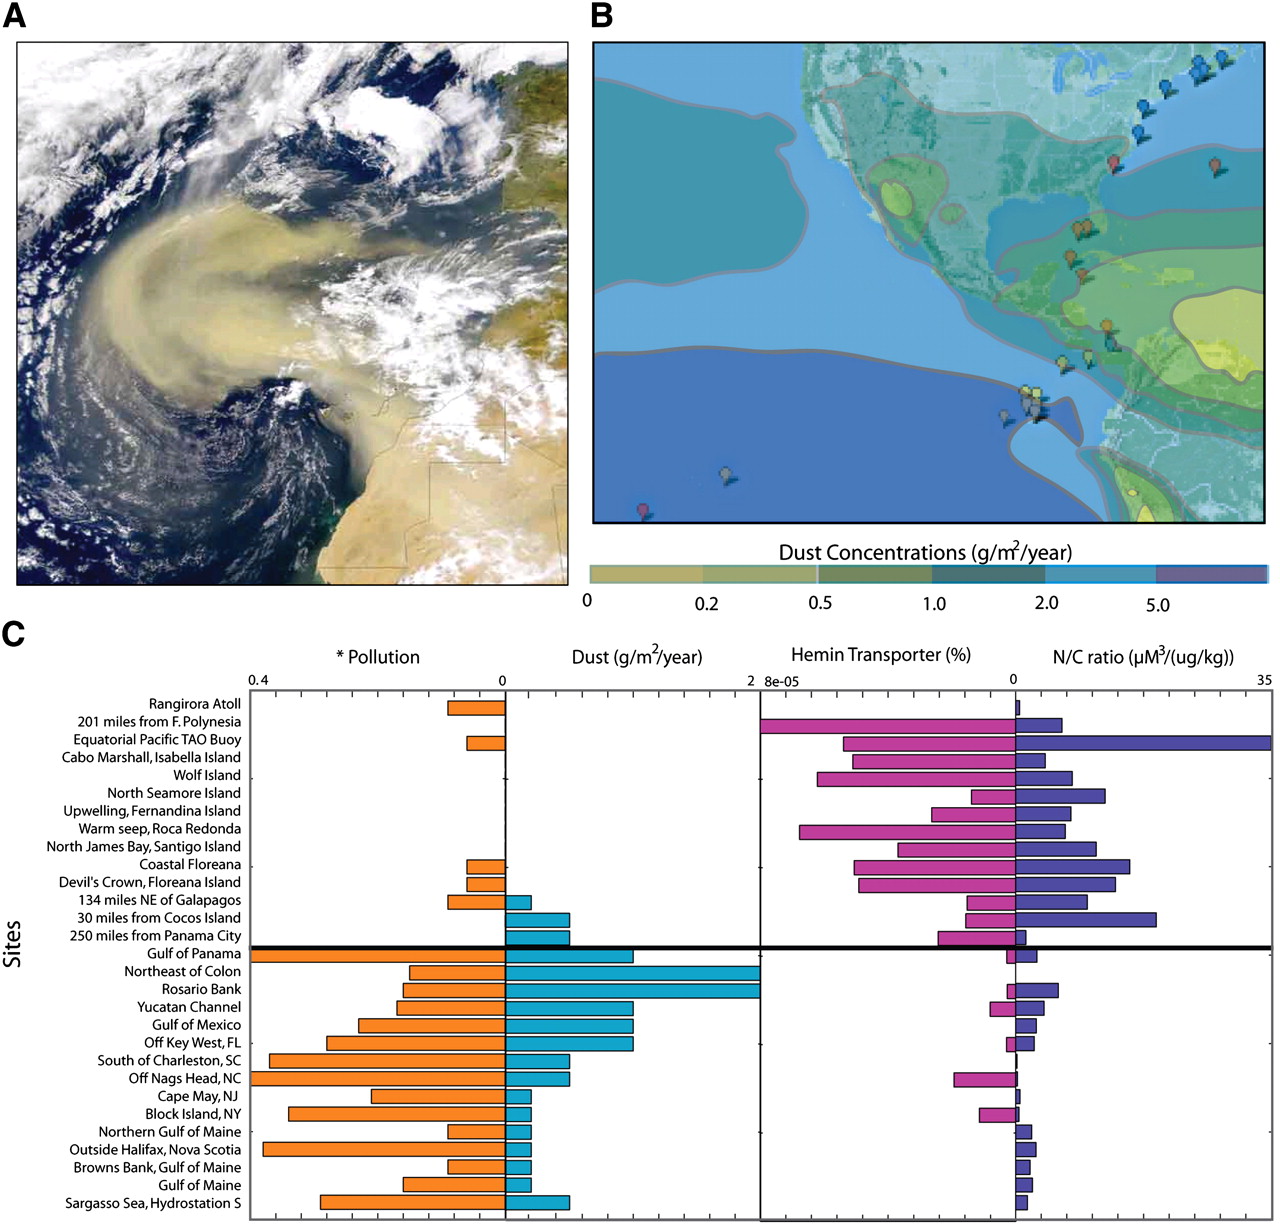
Figure 6.
(A) Image of dust storm off Sahara desert (NASA). (B) Model of dust concentrations (color-coded) across GOS sites, adapted from Jickells et al. (2005). (C) Pollution levels (*, impact value; see Halpern et al. 2008), dust concentrations, percent of ABC-type hemin transport system proteins ([number of COG4558 proteins]/[number of total proteins at site]), and nitrate/chlorophyll ratio values across the 29 GOS sites. The black line shows separation of sites into two sets, one with high pollution and dust and low N/C and iron transporters and vice versa.