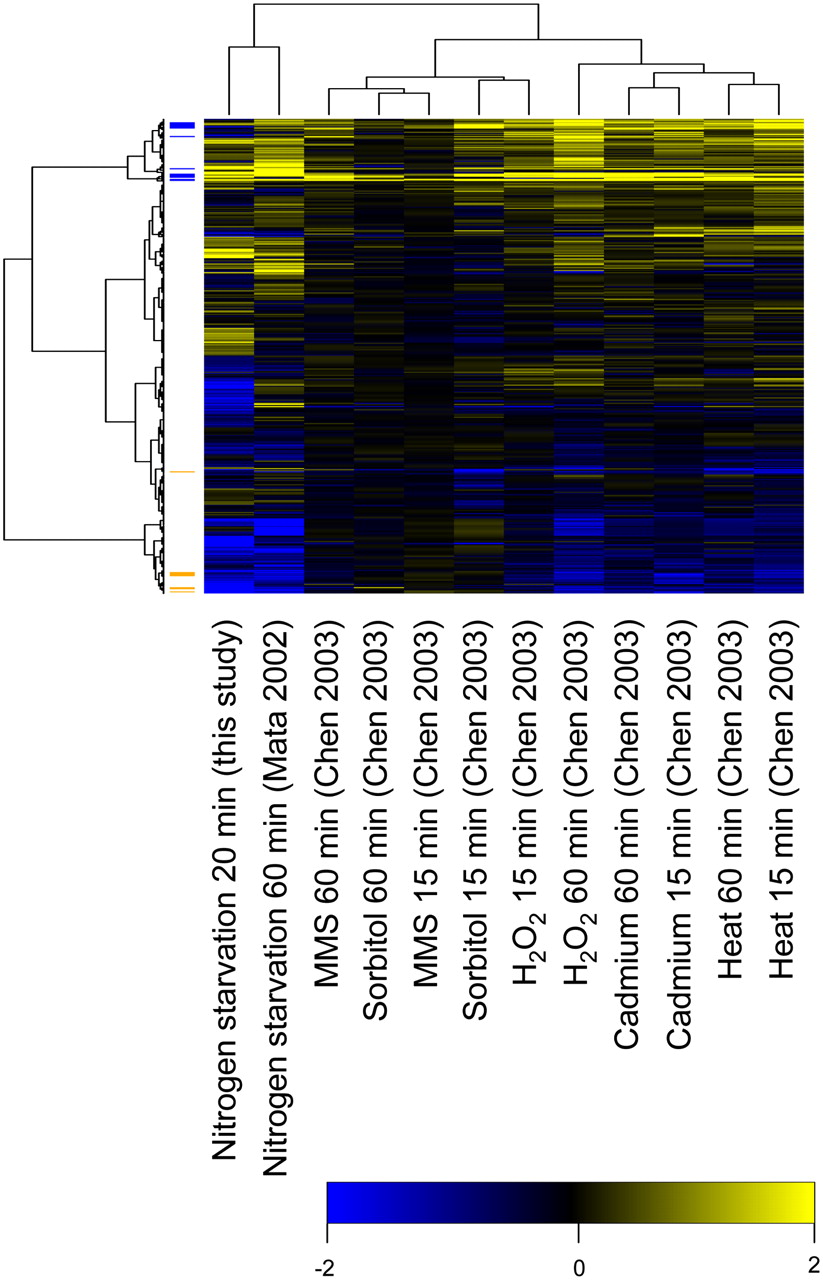
Figure 6.
Hierarchical clustering of stress response gene expression data. The clustering includes 4145 genes (rows) under 12 different stress conditions (columns). Colors indicate gene expression log ratios compared to relevant controls; (yellow) up-regulation; (blue) down-regulation. The 20-min nitrogen starvation data are from the present investigation and the other data are from Mata et al. (2002) and Chen et al. (2003). At left, CESR-induced genes are labeled in blue, and CESR-repressed genes in orange.