Figure 6.
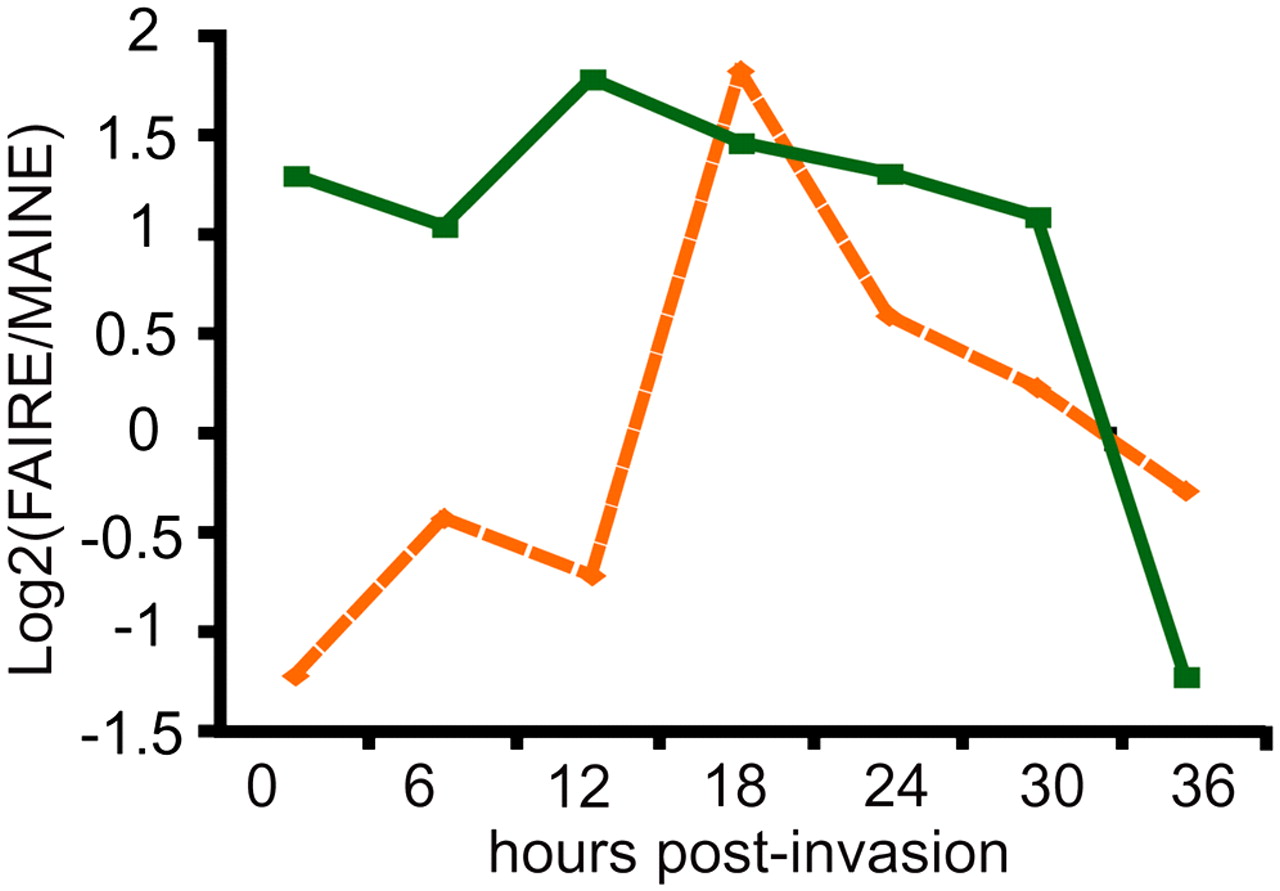
Chromatin status changes in putative promoter regions and introns for var genes. Chromatin status changes in proximal promoter (orange) are compared to those of the corresponding introns (green).
Chromatin status changes in putative promoter regions and introns for var genes. Chromatin status changes in proximal promoter (orange) are compared to those of the corresponding introns (green).