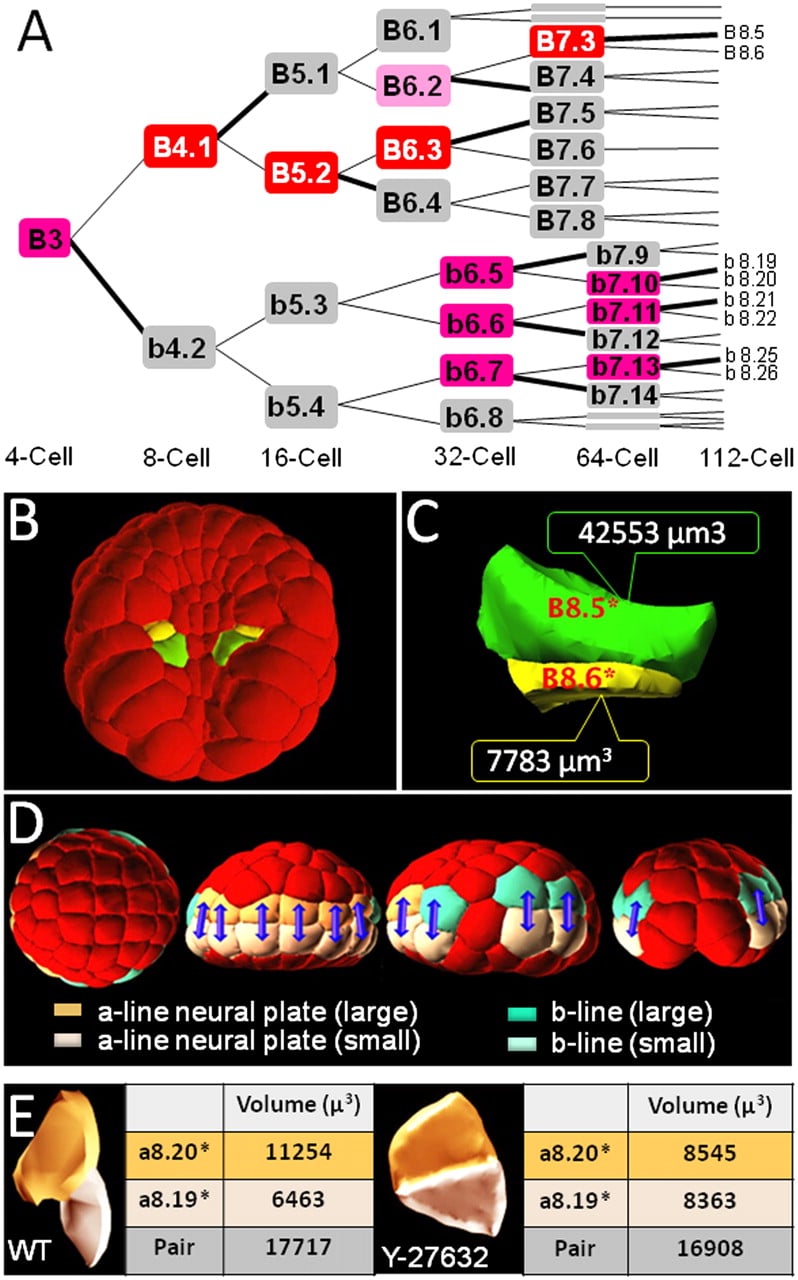
Systematic identification of unequal cell cleavages: (A) Lineage tree for the B3 (posterior) blastomere between the four-cell and the 112-cell stages in Ciona intestinalis. The only blastomeres named are in lineages where unequal divisions occur. (Gray) Cells that divide symmetrically, (light pink) cells with weak asymmetry (index > 15%; Tassy et al. 2006), (pink) cells with marked asymmetry (index > 25%), (red) cells with strong asymmetry (>50%). Supplemental Figure S7 shows all asymmetric divisions up to the 112-cell stage. (B,C) Example of asymmetry between the 64- and 112-cell stages in the vegetal hemisphere of Ciona intestinalis embryos. The yellow (B8.6) and green (B8.5) cells are daughters of the same mother cell (B7.3). Note the important difference in cell volumes between the two sisters. This unequal division is conserved in Halocynthia roretzi (Darras and Nishida 2001). (D) Position of unequally cleaving animal cells between the 76- and 112-cell stages. From the left: animal view, anterior is to the left; frontal view, animal is to the top; lateral view, anterior is to the left, animal to the top; posterior view, animal is to the top. (Blue arrows) Sister cells are linked. (Colors) Lineage and size of cells (see legend). (E) Effect of the inhibition of endoderm invagination with the Rho-kinase inhibitor Y-27632. Side views of the a8.19/a8.20 cell pair in wild-type and Y-treated conditions are shown, as well as a measure of the mean volumes of these cells in the two embryos analyzed.