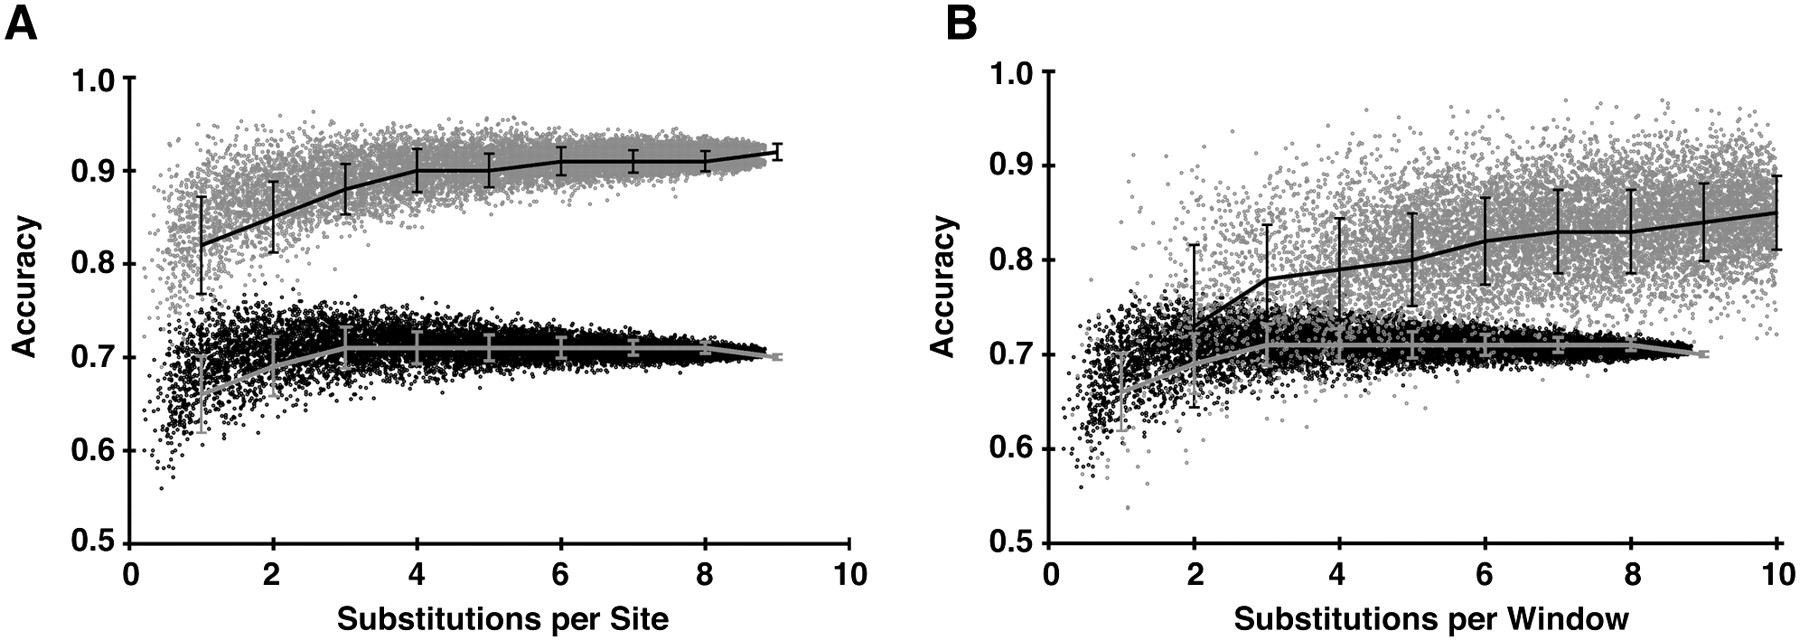
Effect of alignment sequence variation on accuracy. (A) The relationship between accuracy of evolutionary rates analysis (vertical axis) and average substitutions per site in the alignment (horizontal axis) for 10,000 random subalignments of beta-globin. The accuracy of regional evolutionary rates analyses (gray points, black line, and error bars) is compared with accuracy of single-site evolutionary rates analyses (black points, gray line, and error bars). Accuracy scores were binned by alignment substitutions per site, and the average for each bin was plotted (lines). The error shown is plus and minus one standard deviation. (B) The relationship between accuracy and average substitutions per analysis window. Shading and symbols are as in A.