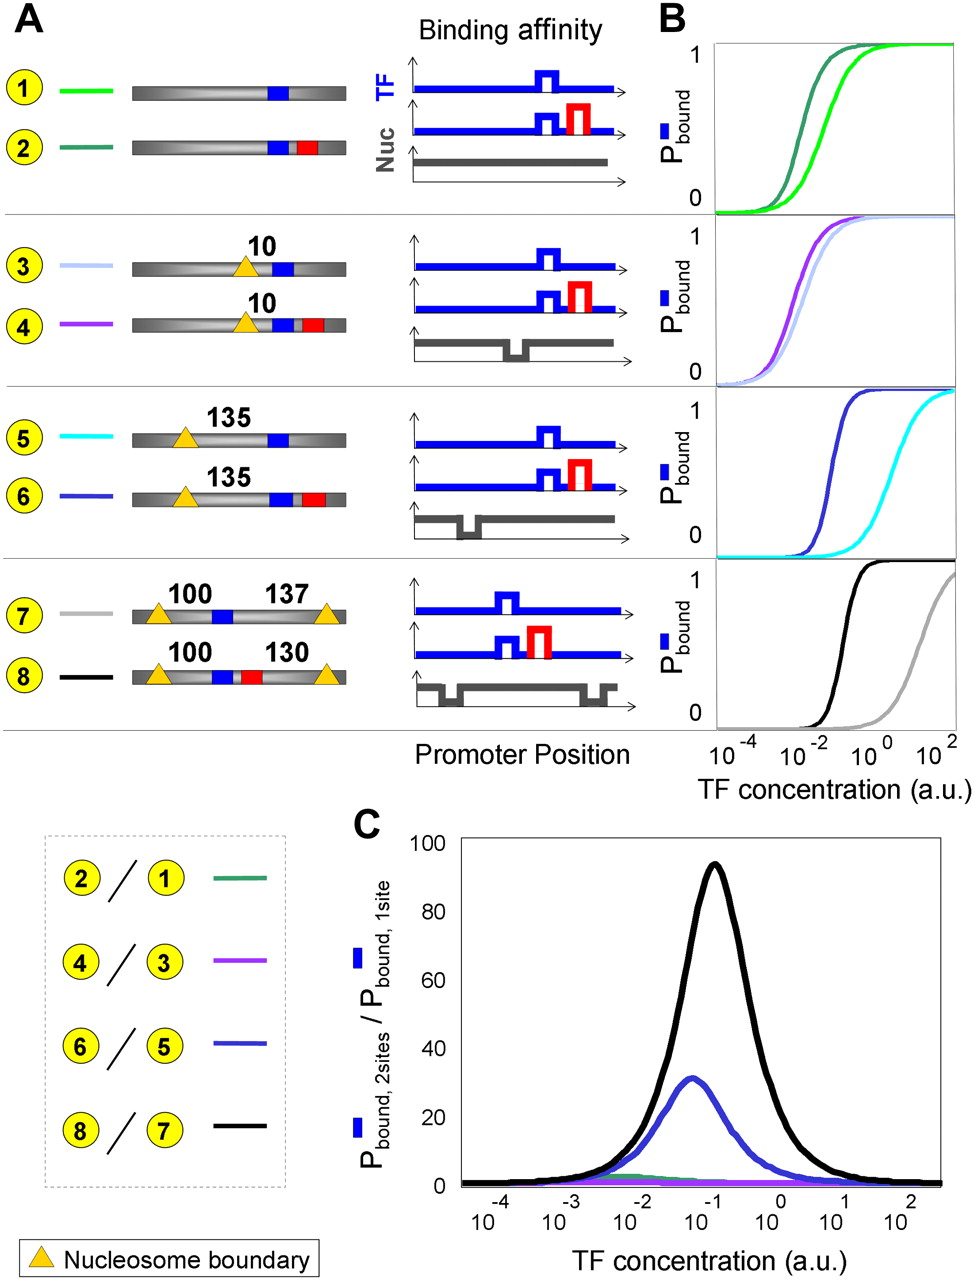
Combination of promoter elements produces a diverse range of activation curves. (A) Schematic illustrations for the promoters used in this figure and the associated binding affinities for nucleosomes and transcription factors. (B) Probability of transcription factor binding to a low-affinity site at increasing transcription factor concentrations for promoters with this low-affinity site as a single site (light colors, Pbound,1site) or for promoters with an additional high-affinity site for the same transcription factor (dark colors, Pbound,2sites). The distance between the two binding sites is set to 1 bp. The sites are located on the promoters at varying distances from one or two boundary elements for nucleosome formation. The energetic contribution ( ) from binding is set to 1200 for a high-affinity site, and 200 for a low-affinity site. (C) The ratio between Pbound,2sites to Pbound,1site from B at increasing transcription factor concentrations. This ratio represents the strength of the cooperative/destructive binding effect between the transcription factors. The ratio obtained is >1, indicating a positive cooperative effect. However, the strength of the effect depends on the locations of the sites relative to the boundary: the ratio is higher for sites that are relatively covered by nucleosomes at low transcription factor concentrations.