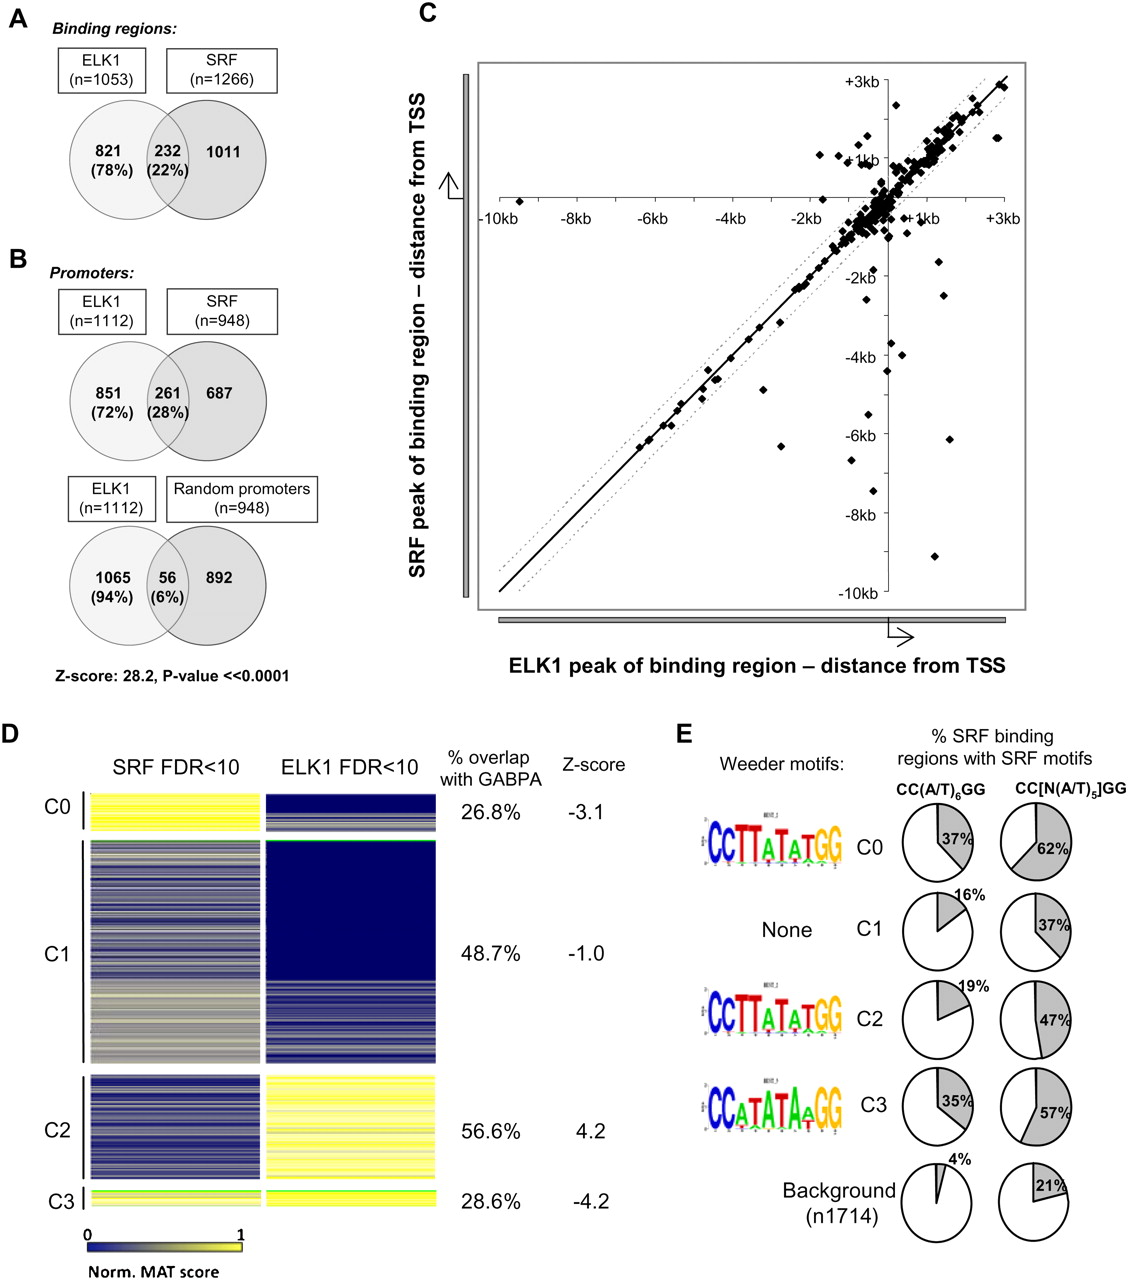
Co-occupancy of promoters by SRF and ELK1 is a common event. (A,B) Overlap between binding events from the ELK1 FDR < 10 and SRF FDR < 10 datasets, when either binding regions (A) or co-occupancy of promoter regions (B) are considered. The overlap between ELK1-binding regions and random equivalently sized promoter datasets is given for comparison in B. The total number of genes in each sector is shown, with percentages also provided relative to the total number of ELK1 targets. (C) Scatter plot of the location of the peak binding positions of ELK1 FDR < 10 and SRF FDR < 10 binding regions relative to their closest and shared gene promoter TSS. The black and dotted lines indicate a distance of 0 and 500 nucleotides between the most significant probes in the ELK1- and SRF-binding region, respectively. (D) Cluster analysis of the ELK1 FDR < 10 and SRF FDR < 10 datasets (set to produce four clusters, C0–C3). The color variations between blue and yellow identify nonbound to strong binding events, respectively (as defined by normalized MAT scores). The percentage overlap of ELK1-binding regions in the four clusters that overlap with all GABPA ChIP-seq regions is shown on the right. The associated Z-score is based upon the chance of observing the same overlap using 1000 random sets of the ELK1 FDR < 10 binding regions compared with the observed overlap between the ELK1-binding regions in the cluster that overlap GABPA-binding regions. Clusters 0–3 contain 208, 1220, 577, and 86 binding regions, respectively. (E) SRF-like motifs identified in each of the four clusters (C0–C3) by Weeder analysis are shown on the left. The percentage occurrence of the CC(W)6GG and more degenerate CC[N(W)5]GG SRF binding motifs in each of the clusters (C0–C3) in comparison to a background data set is shown on the right.