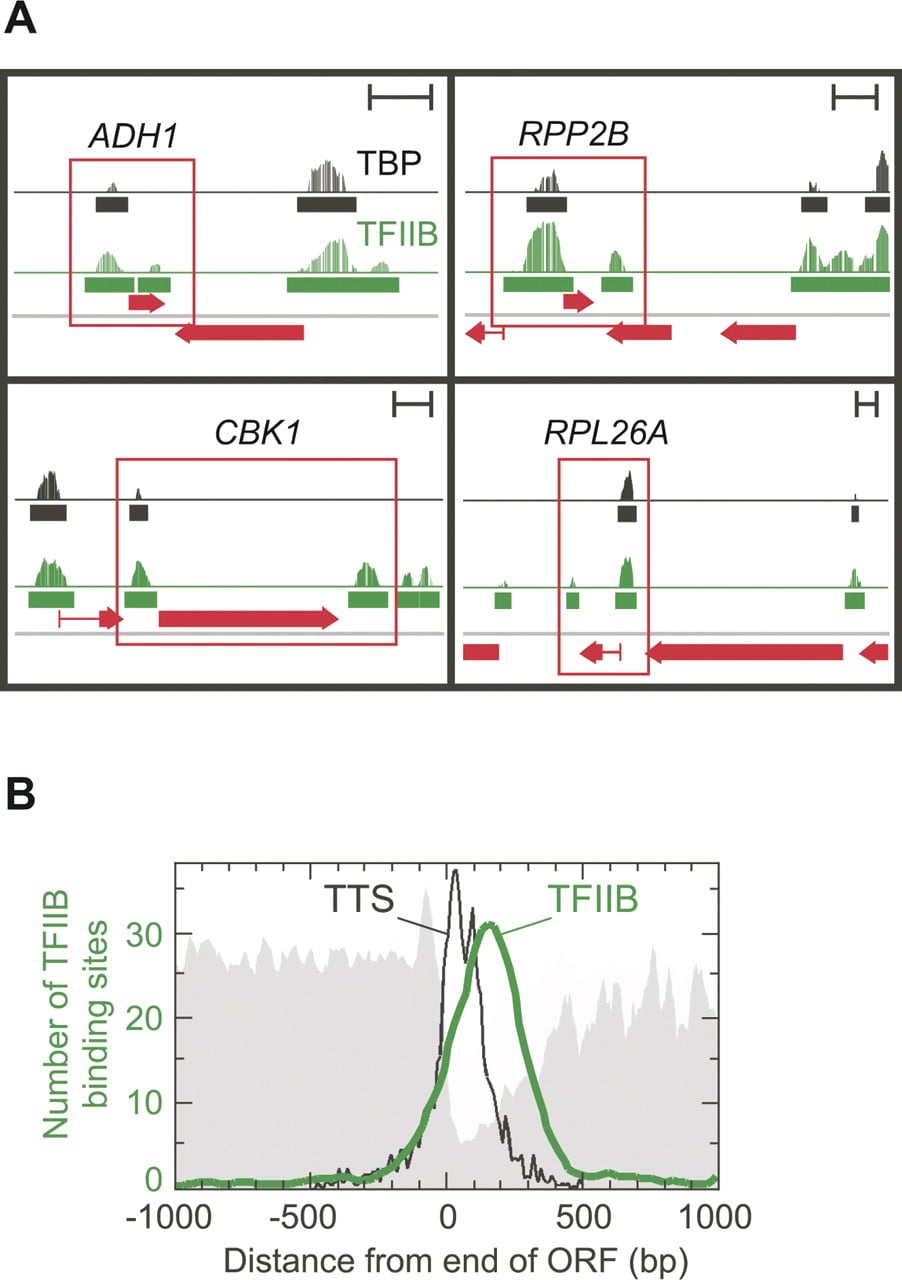
Figure 6.
Distribution of TFIIB around 3′ end of genes. (A) High-resolution mapping of TFIIB at genomic loci. The genome-wide location of TFIIB (Sua7) and TBP were determined by ChIP-chip using high density Affymetrix tiling arrays (5 bp average probe spacing, 3.2 million probes). Results for four potentially looped genes are shown (boxed in red). Vertical bars reflect binding strength (TFIIB in green; TBP in black), and horizontal bars represent binding locations. Scales in upper right corner of each box represent 500 bp. (B) Composite distribution of TFIIB at the end of genes. Plots of nucleosomes (gray backdrop), TTS (black trace), and TFIIB (green trace) are shown.