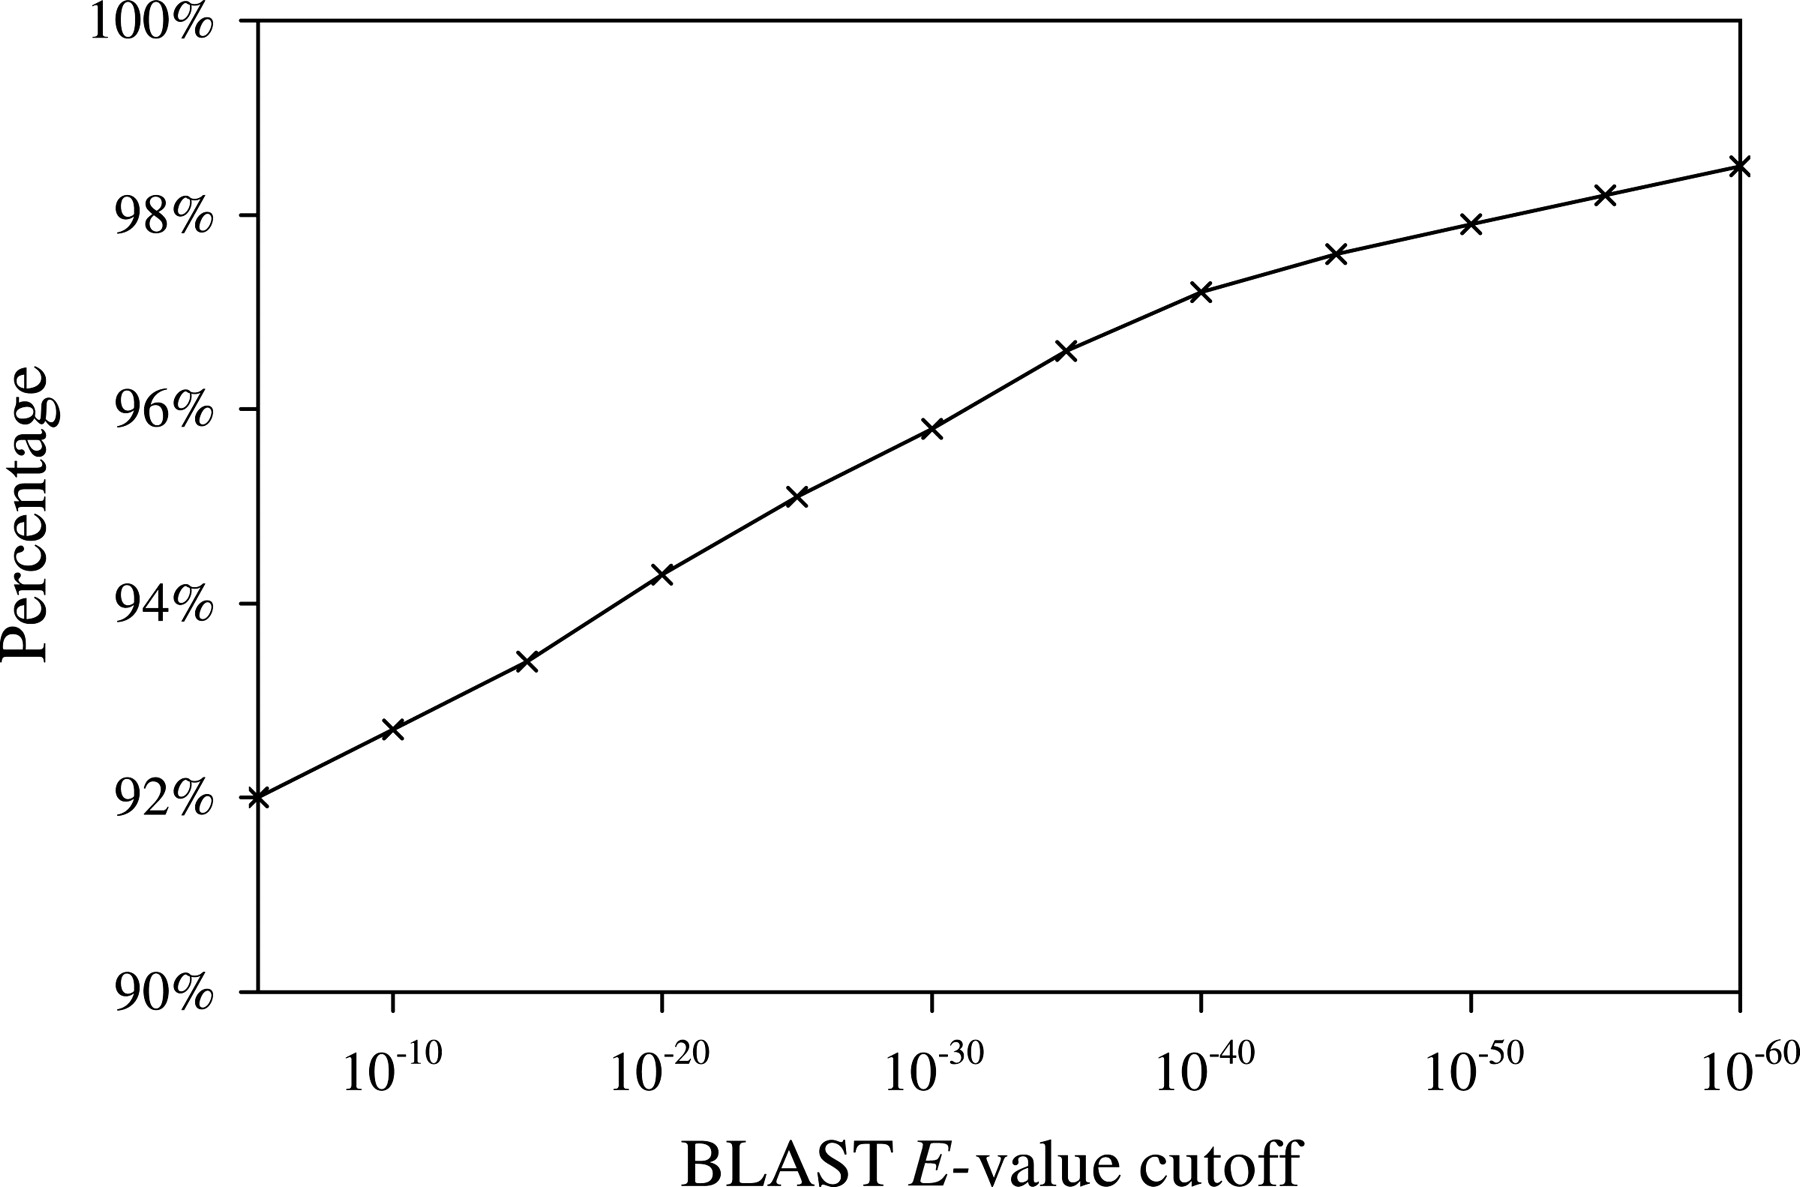
Percentage of clusters in which all genes share the same orientation for different BLAST E-value cutoffs.