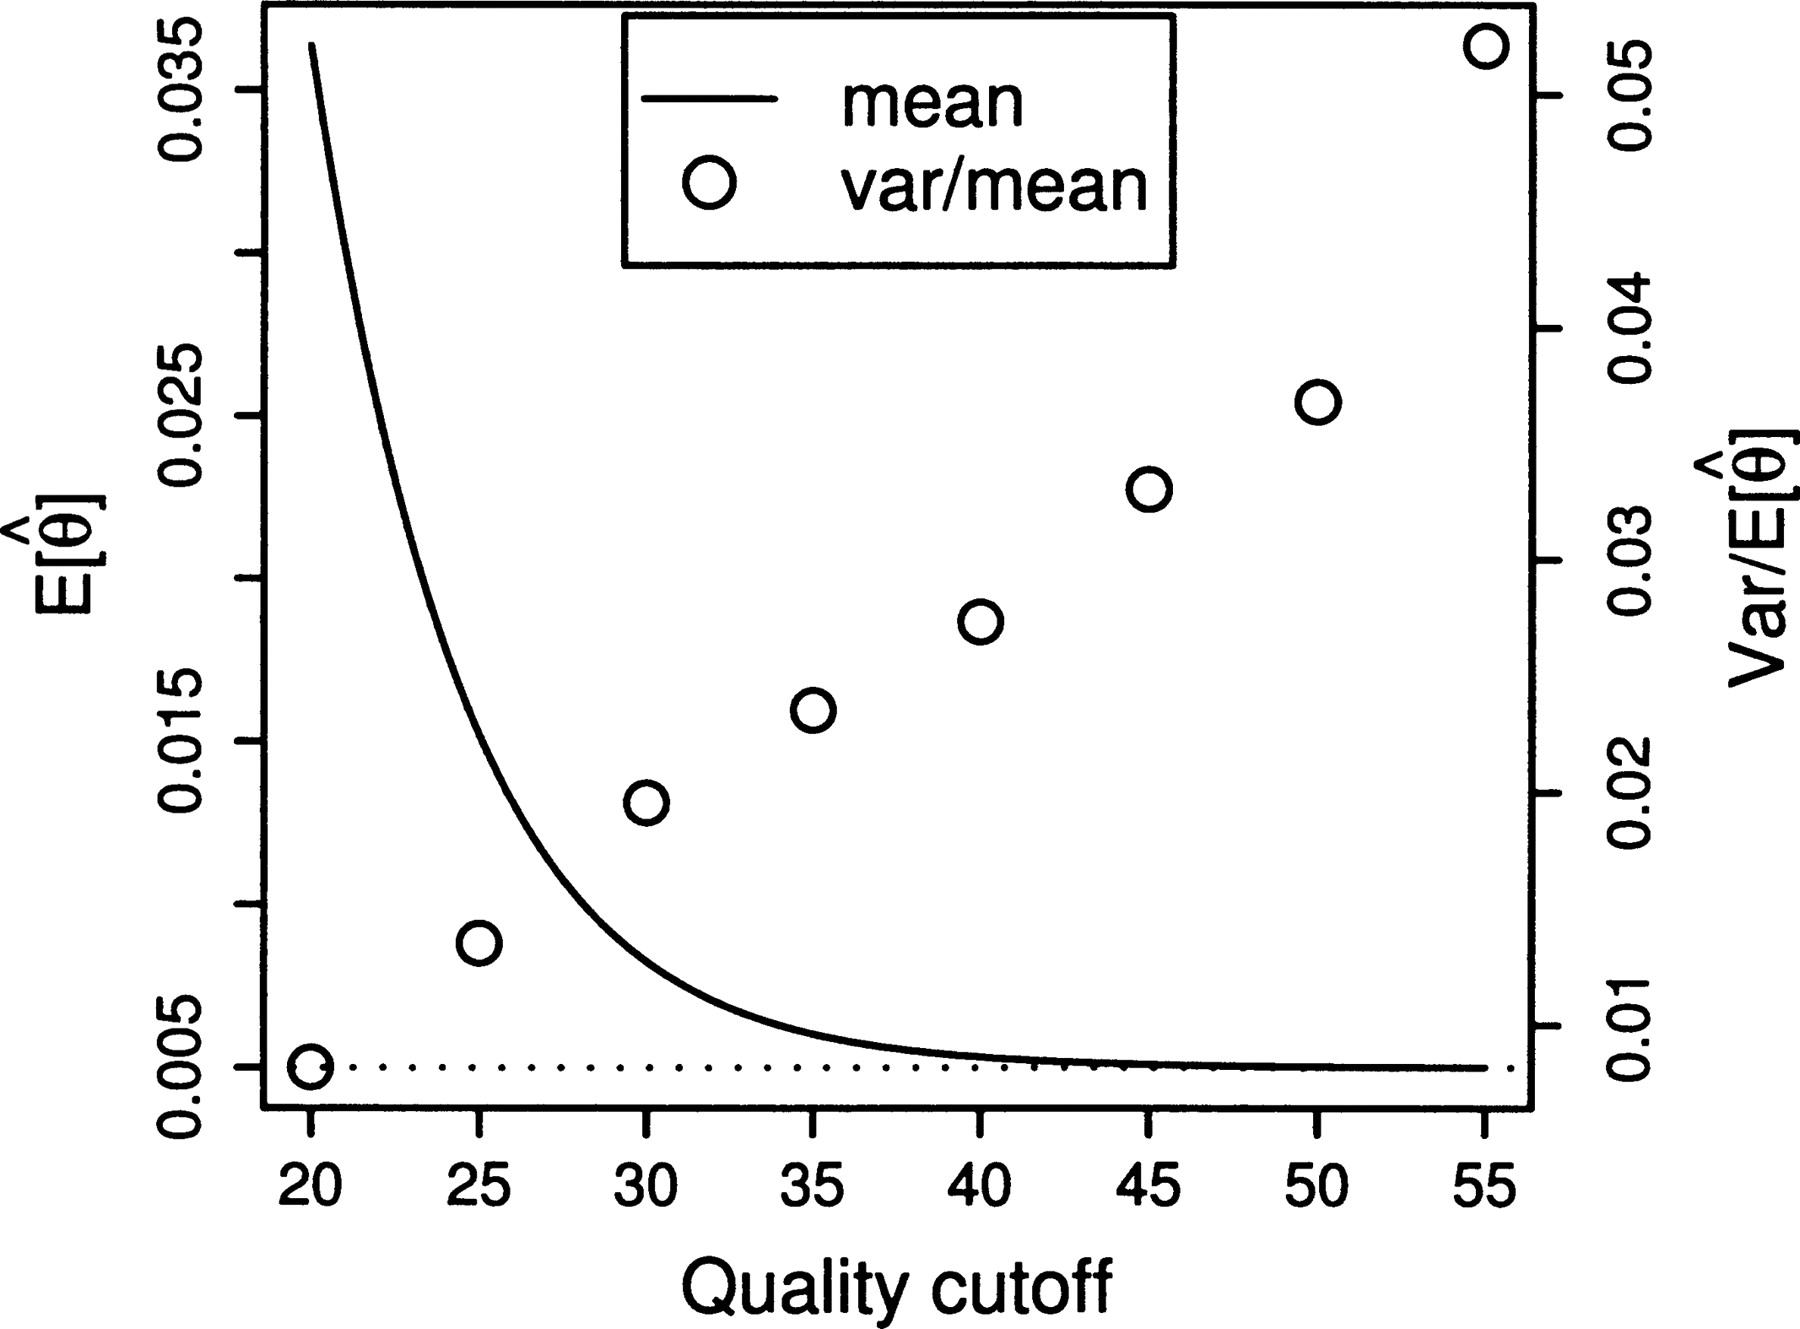
Figure 6.
Estimating θ by using an arbitrary quality cutoff (throwing out data below, trusting data above). Solid line shows (analytic) best-case estimate, assuming no sampling error for a depth of nine and constant quality at the cutoff level. Dotted line shows true value (θ = 0.01). Open circles plot standard deviation/mean when run on a finite sample of 170,000 sites with depth of nine and constant quality, but where the cutoff further reduces the number of sampled sites according to the sludge quality distribution.