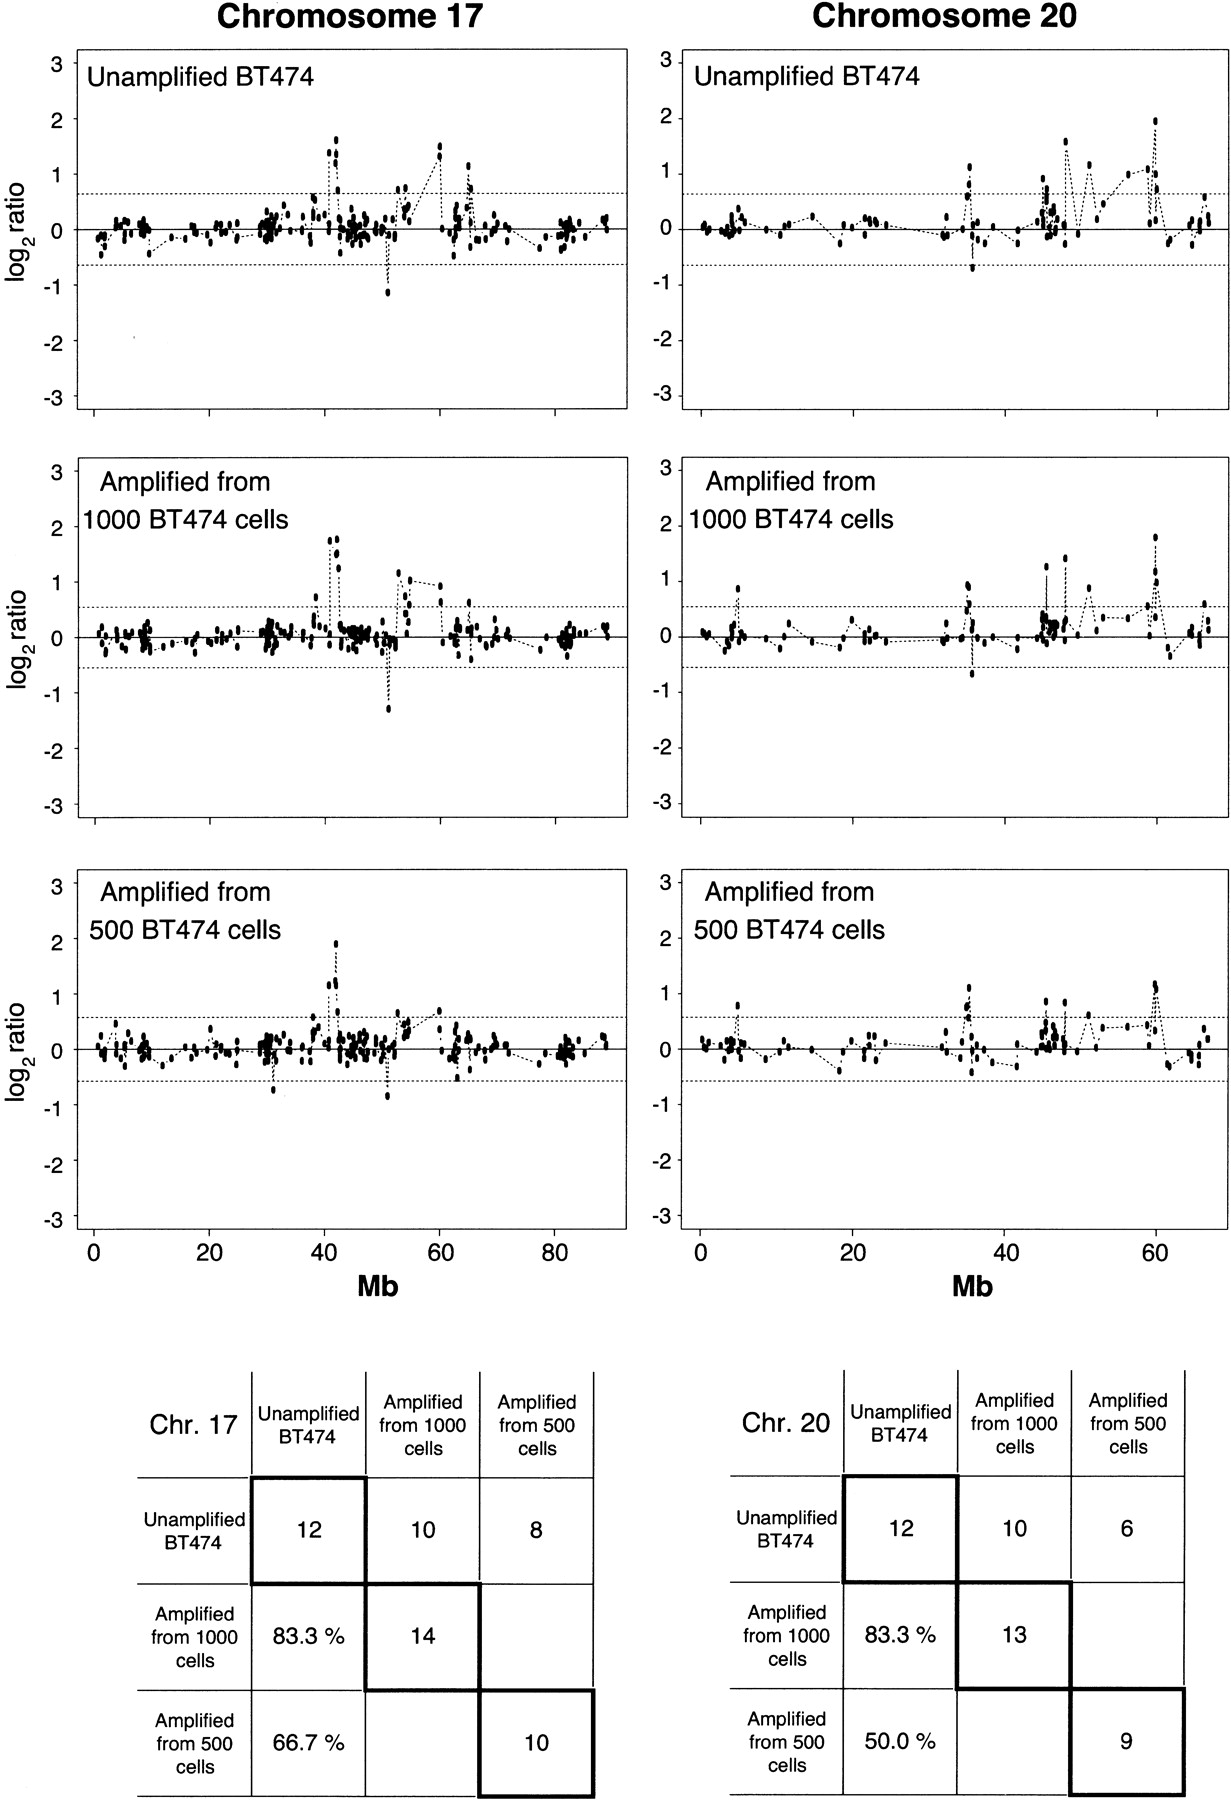
Enlarged representation of array–CGH data for Chromosomes 17 and 20. Chromosomes 17 and 20 are known to contain notorious amplifications in the breast cancer cell line BT474. Chromosome 17 is represented in the microarray by 221 cDNAs, and Chromosome 20 by 99 cDNAs. Note that the profiles for Chromosomes 17 and 20 are mostly conserved for the whole genome-amplified samples from different inputs of DNA (equivalent to 500 and 1000 cells) compared with one of the unamplified experiments. The number of altered genes and percentage of concordance of the amplified experiments to the unamplified control are presented in the tables below the plots. The values in diagonal show the total number of altered genes in every experiment for Chromosomes 17 and 20 separately. The first row of each table contains the number of altered genes in common for every amplified experiment compared with the unamplified control. Likewise, the first column of each table gives the percentage of concordance for altered genes found in common between each amplified experiment and the total number of altered genes in the unamplified control. Nonparametric bounds are −0.642 and 0.642 for the unamplified experiment, −0.546 and 0.546 for the experiment using amplified DNA from 1000 cells, and −0.574 and 0.573 for the experiment using amplified DNA from 500 cells.